

A KPI dashboard is not a software solution; it’s a strategic steering wheel that only works when it prioritises leading indicators over historical reporting. Most business leaders feel the weight of information overload, often drowning in messy spreadsheets whilst trying to manage the constant anxiety of a tightening cash flow runway. It’s a common struggle to make high-stakes decisions based on a gut feel rather than hard, objective data. You deserve a clearer path forward.
This guide will show you how to transform raw data into a powerful tool that predicts growth and protects your capital. By implementing a tailored kpi dashboard for sme owner, you can move from reactive firefighting to proactive leadership. We’ll explore the essential metrics for 2026, the move towards automated reporting, and how to establish early warning signals that give you the confidence to invest in your company’s future. With the right visibility, you can stop guessing and start scaling with precision.
Key Takeaways
- Learn why a high-performance kpi dashboard for sme owner must prioritised leading indicators rather than just historical data to predict future performance.
- Discover how to categorise metrics into the four essential pillars of cash, sales, operations, and people to ensure a holistic view of your business health.
- Understand the methodology for mapping data points to your three primary strategic objectives, helping you filter out noise and focus on what truly drives value.
- Identify the leading signals that act as early warning systems for your cash flow, allowing you to make adjustments before financial issues arise.
- Recognise how professional interpretation from a Finance Director transforms a static dashboard into a dynamic tool for future-proofing your organisation.
What is an SME KPI Dashboard and Why Does it Matter?
A kpi dashboard for sme owner is far more than a simple visual display of historical performance. It functions as a high-level executive briefing tool, providing the clarity required to steer a growing organisation through volatile markets. Whilst many owners rely on a basic Performance indicator to track sales, a truly strategic dashboard connects these numbers to your long-term objectives. It moves you away from the engine room of operational reporting and into the cockpit of strategic oversight.
Making decisions based on gut feel often leads to a cycle of reactive firefighting. By contrast, a data-driven approach facilitates scaling by replacing anxiety with evidence. There is a profound psychological benefit to having a single source of truth. It allows you to lead with composure, knowing that your growth plans are backed by hard numbers rather than optimistic guesses. When you have one clear view of business health, you stop second-guessing your strategy and start executing it.
The Problem with “Dashboard Fatigue”
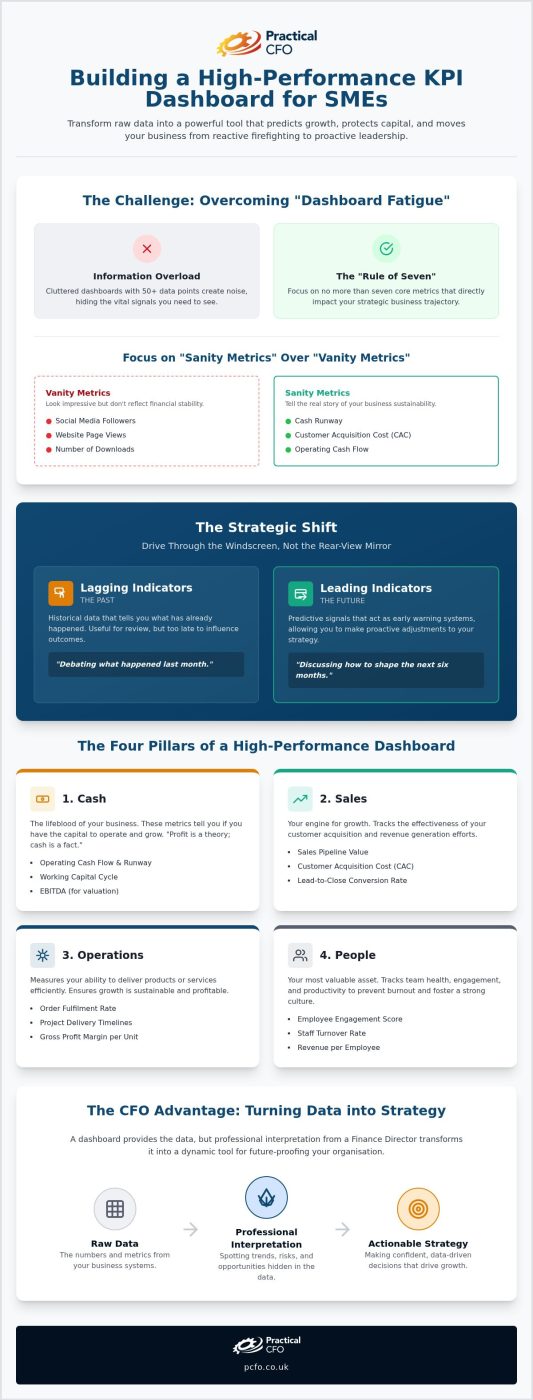
Tracking too many metrics is amongst the most frequent mistakes we see in the SME sector. When a dashboard is cluttered with fifty different data points, the vital signals get lost in the noise. We recommend the “Rule of Seven” for owner-level visibility. This means focusing on no more than seven core metrics that directly impact your business trajectory. You must distinguish between “vanity metrics” and “sanity metrics.” Vanity metrics, such as social media followers, might look impressive, but they don’t reflect financial stability. Sanity metrics, like your cash runway or customer acquisition cost, tell the real story of your sustainability.
Moving from Reporting to Strategic Oversight
In 2026, real-time visibility is a necessity rather than a luxury. Traditional monthly post-mortems are often too late to influence the outcome of a challenging quarter. A modern kpi dashboard for sme owner changes the nature of board meetings. Instead of debating what happened last month, you spend your time discussing how to shape the next six months. This shift from historical reporting to future-looking navigation is what separates stagnant companies from those that scale.
The accuracy of this data is paramount. High-quality outsourced accountancy solutions ensure that the underlying figures feeding into your dashboard are precise and up-to-date. When your financial foundations are solid, your dashboard becomes a proactive tool for future-proofing your business. It allows you to spot trends before they become problems, ensuring your strategy remains agile and effective.
The Four Pillars of a High-Performance SME Dashboard
A robust kpi dashboard for sme owner must extend beyond simple profit and loss statements. To truly understand the health of your business, you need a holistic view that covers four critical areas: Cash, Sales, Operations, and People. Financial metrics are lagging indicators; they tell you what has already happened. To predict what will happen next, you must balance these with operational and people-centric data. Your dashboard should be a direct reflection of your business growth advisory uk objectives, ensuring every metric tracked serves a strategic purpose.
Focusing on all four pillars prevents the common mistake of chasing revenue at the expense of sustainability. For example, a surge in sales is only positive if your operations can fulfill the orders and your people aren’t reaching burnout. By categorising your KPIs this way, you create a balanced scorecard that protects your cash flow whilst identifying opportunities for scalable growth. Aligning these pillars requires a clear vision, often facilitated through professional business growth advisory uk to ensure your data supports your long-term ambitions.
Financial Health and Cash Flow
Profit is a theory; cash is a fact. Whilst your P&L might look healthy, your operating cash flow and runway are the metrics that keep you in business. We focus on the working capital cycle to identify where cash is trapped in the business, whether in unpaid invoices or excess stock. If you are considering a future sale, tracking EBITDA (Earnings Before Interest, Taxes, Depreciation, and Amortisation) is essential. High-quality exit strategy planning services rely on clear, historical EBITDA trends to maximise business value. Monitoring these figures weekly prevents the sudden cash crunch that often stalls scaling SMEs.
Sales Pipeline and Customer Metrics
Your sales pillar provides the fuel for growth. It’s not enough to track total revenue; you must understand the efficiency of your acquisition and the loyalty of your base. We recommend monitoring several key areas:
- Customer Acquisition Cost (CAC) vs Lifetime Value (LTV): This ratio determines if your growth is actually profitable over the long term.
- Churn Rates: High churn is an early warning sign of underlying service issues that will eventually impact your bank balance.
Customer satisfaction scores act as an essential leading indicator. A dip in satisfaction today is almost always a dip in revenue tomorrow. By monitoring these signals within your kpi dashboard for sme owner, you can adjust your strategy before the financial impact hits the bottom line.
Leading vs. Lagging Indicators: Driving Through the Windscreen
Driving a business solely by looking at profit and loss is like driving a car by looking through the rearview mirror. Revenue and profit are lagging indicators; they report on what has already happened. Whilst these figures are essential for compliance and tax, they offer little help when you need to navigate future obstacles. A strategic kpi dashboard for sme owner must prioritise leading indicators, which act as the windscreen, allowing you to see the road ahead clearly.
Building a predictive model within your dashboard transforms data from a history lesson into a steering tool. If you wait until your bank balance drops to react, you’ve already lost the opportunity to fix the underlying issue. By tracking the activities that create revenue today, you can predict your bank balance for next month with high accuracy. This proactive stance is what prevents growth-stalling surprises and ensures your capital remains protected.
Predicting Growth with Leading Indicators
Leading indicators are the measurable precursors to financial success. For instance, enquiry volume and quote turnaround times are vital signals for most SMEs. If enquiry volume drops by 15% this week, you don’t need to wait for next month’s sales report to know revenue will soon follow suit. Weighting these indicators based on historical conversion rates allows you to build a reliable forecast. This data should directly inform your strategic budgeting, ensuring your spending remains aligned with realistic income expectations rather than optimistic projections.
Balancing the Dashboard for 2026
For optimal strategic oversight in 2026, we recommend a 70/30 split between leading and lagging indicators. This ratio ensures your primary focus remains on future performance whilst still acknowledging historical results. Implementing “Red-Amber-Green” (RAG) status alerts within your kpi dashboard for sme owner provides immediate visual cues for action. A green light confirms you’re on track, whilst a red alert on lead conversion or pipeline velocity warrants an immediate tactical pivot.
This is where the expertise of a finance director becomes invaluable. They don’t just report the numbers; they use these signals to adjust the company’s trajectory in real-time. Having a professional who can interpret the story behind the RAG status allows you to make calm, evidence-based decisions instead of panic-driven changes. This level of foresight is essential for any SME owner aiming to scale securely amongst shifting market conditions.
How to Organise and Implement Your Dashboard
Implementation of a kpi dashboard for sme owner begins with strategy rather than software. You must first identify three core business objectives for the year. Whether your focus is on increasing net margin by 5% or reducing customer churn by 10%, every metric you track must directly support these goals. Mapping your KPIs this way avoids the “everything” trap, where an abundance of data obscures the vital signals you need to see. It ensures your focus remains on the numbers that truly move the needle.
Choosing your tech stack is the next critical hurdle. You must decide between a pure software approach and a human-led strategy. Our guide on fp&a consultant vs software uk details why software alone often fails to provide the necessary context for strategic decisions. Once your tools are in place, establish a weekly review cadence with your leadership team. Refine the dashboard monthly. If a metric doesn’t drive action or change your behaviour, it’s noise and should be removed.
Choosing the Right Visualisation Tools
Bespoke dashboards offer maximum flexibility, whilst off-the-shelf software provides speed and ease of setup. Busy owners require mobile-accessible views to monitor business health whilst away from the office or travelling between meetings. You should also ensure your setup includes robust data security and access controls amongst your team. This protects sensitive financial information whilst empowering department heads with the specific data they need to perform their roles effectively.
Establishing the Review Cadence
Consistency is the foundation of a data-driven culture within an SME. A weekly “pulse” check identifies immediate operational issues, whilst a monthly “deep dive” focuses on long-term strategic alignment. We recommend running your board meetings directly from the dashboard to keep discussions grounded in objective reality. Assigning “owners” to specific KPIs ensures accountability; someone must be responsible for the story behind every number. If you need help building a dashboard that actually drives growth, our Finance Director Services provide the expert oversight needed to turn raw data into a strategic asset.
The CFO Advantage: Turning Data into Strategy
A kpi dashboard for sme owner provides the visibility required for growth, but the raw data is essentially silent without professional interpretation. Whilst software can aggregate figures, it cannot provide the strategic context needed to navigate complex financial decisions. A Fractional FD acts as an embedded advisor who identifies the “story” behind the numbers, distinguishing between a temporary dip in performance and a fundamental shift in market conditions. This level of insight ensures that your leadership team reacts to trends rather than noise.
High-quality data visualisation is particularly critical when you are preparing for a significant milestone, such as securing external funding or planning a business exit. Investors and buyers in 2026 demand a level of transparency that only a well-maintained dashboard can provide. It demonstrates that you have a firm grip on your operations and a proactive approach to risk management. Understanding the fractional cfo pricing uk helps owners weigh the investment against the significant return on investment that strategic oversight provides during these high-stakes transitions.
Strategic Interpretation vs. Data Entry
Owners often make the mistake of spending their own valuable time building and maintaining these tools. Your role is to lead the organisation, not to manage data entry or troubleshoot software integrations. A seasoned strategic partner provides a calm, experienced hand during periods of financial turbulence, bridging the gap between basic accounting and high-level strategy. At PCFO, we ensure your financial foundations are solid so that your kpi dashboard for sme owner reflects the true trajectory of your business rather than an idealised version of it.
Next Steps for Your SME
To begin the transition to a data-led culture, we recommend conducting a “KPI Audit.” This process involves stripping away any metrics that don’t directly influence your decision-making or impact your bottom line. Once you have a lean, focused set of indicators, integrate your dashboard into your long-term business plan to ensure daily actions align with your five-year vision. If you are ready to move beyond spreadsheets and gut feel, requesting a consultation is the first step towards building a bespoke strategic dashboard that protects your cash flow and facilitates sustainable growth. Our experts are ready to help you turn your raw data into a powerful steering wheel for your organisation’s future.
Steering Your Business with Confidence
Transforming your financial data into a strategic asset is the most significant step you can take towards scalable growth in 2026. By balancing leading and lagging indicators across the four critical pillars, you move from reactive management to proactive leadership. This clarity allows you to protect your cash flow whilst identifying the exact moments to invest in your organisation’s future. A robust kpi dashboard for sme owner acts as your primary navigation tool in an increasingly complex market.
Success requires more than just software; it demands the intellectual rigour of professional interpretation. Our team provides the fractional FD expertise needed to turn raw data into board-level strategy, whether you’re preparing for a strategic exit or navigating rapid expansion. We offer a steady, experienced hand to ensure your dashboard remains a precise steering wheel rather than a source of information overload. Book a strategic consultation with PCFO to build your bespoke KPI dashboard and gain the reassurance of having elite financial leadership at your side. You have the vision for your business; we provide the data-driven confidence to reach it.
Frequently Asked Questions
What is the most important KPI for an SME owner to track?
Whilst every business is unique, operating cash flow is arguably the most critical metric. It represents the actual cash generated by your business operations rather than just theoretical profit. Tracking your cash runway ensures you have the liquidity to meet obligations and fund growth. For a kpi dashboard for sme owner, this figure provides the ultimate sanity check, allowing you to lead with confidence knowing exactly how much capital is available for strategic investment.
How often should I review my business dashboard?
You should establish a two-tier review cadence for maximum effectiveness. A weekly “pulse” check allows you to spot operational bottlenecks and immediate cash flow shifts. This is followed by a monthly strategic “deep dive” where you assess long-term trends against your annual business plan. This methodical rhythm ensures you remain agile enough to react to short-term changes whilst keeping your organisation aligned with its broader growth objectives and exit strategy goals.
Can I build a KPI dashboard in Excel or do I need specialist software?
You can certainly start with Excel or Google Sheets, but specialist cloud software often provides superior automation and real-time accuracy. Tools like Power BI or Looker Studio integrate directly with your accounting platforms, reducing the risk of manual data entry errors. Whilst spreadsheets are flexible, they can become unwieldy as you scale. Moving to a dedicated kpi dashboard for sme owner allows for mobile accessibility and more sophisticated data visualisation for your leadership team.
What is the difference between a KPI and a business metric?
A business metric is any data point you can track, whereas a Key Performance Indicator (KPI) is a metric that is critical to your strategic success. For example, website traffic is a metric, but the conversion rate of enquiries into signed contracts is a KPI. Metrics provide broad context, but KPIs focus your attention on the specific levers that drive revenue, protect margins, and facilitate the long-term scaling of your organisation.
How do I know if my KPIs are actually leading indicators?
Leading indicators are activities that happen today which predict a financial outcome tomorrow. To verify this, look for a historical correlation between the metric and your revenue. For instance, if a spike in quote requests consistently results in higher sales three weeks later, quote volume is a reliable leading indicator. These signals allow you to drive through the windscreen, providing the foresight needed to adjust your strategy before lagging indicators, like profit, reflect the change.
Should I share my KPI dashboard with my entire team?
Transparency is beneficial, but you should restrict sensitive financial data to your senior leadership team. Sharing departmental KPIs with relevant staff fosters a culture of accountability and helps employees understand how their daily actions impact the company’s goals. For example, your sales team should see their pipeline velocity, whilst operations should track fulfilment times. This targeted visibility empowers your team without exposing the full complexities of the company’s financial position or cash runway within your kpi dashboard for sme owner.
What happens if my dashboard shows my business is underperforming?
Underperformance on your dashboard should be viewed as a vital early warning signal rather than a failure. It provides the objective evidence needed to pivot your strategy before a minor trend becomes a major financial crisis. When a KPI shows a red status, it prompts an immediate investigation into the root cause. This proactive approach allows you to make calm, evidence-based adjustments to your operations, marketing, or cost base, ensuring your business remains resilient.
How much does it cost to have a Fractional FD set up a dashboard?
The cost of engaging a Fractional FD to implement a dashboard is typically structured as a strategic investment based on the complexity of your requirements. Rather than a simple setup fee, the value lies in the ongoing strategic interpretation and ROI generated by improved decision-making. Professional oversight ensures your dashboard is built on accurate data from your outsourced accountancy solutions, providing a level of board-level leadership that helps future-proof your organisation and maximise its eventual valuation.