

A favourable variance isn’t always good news. Variance analysis in management accounting compares actual results with a benchmark, such as a budget, to show where performance differs from plan. It can examine a whole financial statement or a single line item, but the result needs context before it can guide a management decision.
That distinction matters when you’re assessing whether spending, revenue or operational performance is genuinely on track. A variance highlights a difference; it doesn’t explain the cause or, by itself, tell you what to do next.
This article explains how variance analysis works, what favourable and adverse results mean, and how managers can use findings for cost control, accountability and planning. You’ll see how sales, materials and labour variances reveal different pressures, why unusual or substantial differences deserve attention, and how investigating their causes can inform future decisions. The aim is to turn budget comparisons into a clearer picture of business performance, not just numbers to report and file away.
Key Takeaways
- Compare actual results with a suitable budget or standard to identify where performance has differed from plan.
- Interpret favourable and adverse results in context; a lower cost may come with trade-offs that affect quality or waste.
- Investigate the largest or most unusual differences to focus management attention and guide corrective action.
- Use findings to strengthen cost control and accountability, while bringing the lessons into future planning.
What is variance analysis?
Variance analysis compares budgeted or standard figures with actual results, showing where performance differed from plan. In management accounting, it can cover a whole financial statement or a single line item.
Comparing budgeted and actual figures
A variance is the difference between a planned benchmark and the actual result for the same measure and period. Comparing like with like helps you see whether revenue, materials, labour or overheads followed expectations. For example, if production’s standard requirement is 10,000 pieces of material but actual use is 15,000, the quantity variance is unfavourable. The comparison flags a gap to investigate, not its cause.
Variance analysis, budgets and forecasts
A budget provides a benchmark for comparison, while a forecast updates expectations using current business information. Variance analysis measures actual performance against the chosen benchmark, often during the financial close. For example, a revenue variance is actual revenue minus expected revenue for a specified period. Comparing results with both the budget and the latest forecast can show whether performance departed from the original plan or current expectations have changed.
Fixed overhead budget and volume variances
A fixed overhead budget variance compares actual fixed indirect costs with the budget; a volume variance reflects activity levels and capacity utilisation. Together, they help separate spending differences from the effect of producing at a different level than planned. For example, actual fixed overhead above budget creates an adverse expense variance, while lower production can affect the overhead allocated to output. This distinction helps explain what changed.
Sales price and volume variances
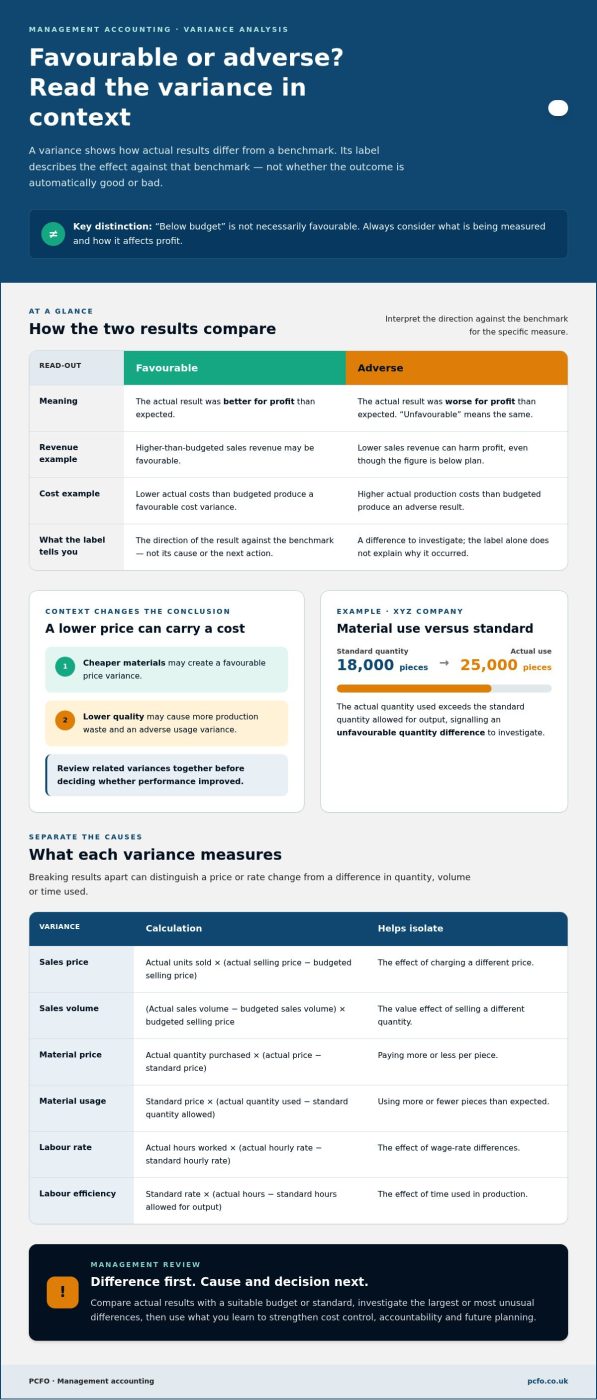
A sales price variance is calculated by multiplying actual units sold by the difference between the actual and budgeted selling prices. It isolates the effect of charging a different price. A sales volume variance is the difference between actual and budgeted sales volume, multiplied by the budgeted selling price. This shows the value effect of selling a different quantity, helping managers distinguish price changes from shifts in demand or sales volume.
Cost control, accountability and future planning
Standard costing sets predetermined material, labour and overhead amounts for each unit produced. XYZ Company’s standard cost card provides benchmarks for comparing actual inputs with expected requirements.
Cost and quantity standards
A cost standard sets an expected rate, whilst a quantity standard sets the input required for a unit of output. XYZ Company’s card specifies six material pieces and 1.3 labour hours per gadget. Comparing actual use with these standards separates price changes from differences in resource consumption. Managers can then assess whether production methods, purchasing decisions or working practices need attention.
Cost variance and cost control
Cost variance is actual cost minus budgeted cost, showing the financial difference between spending and plan. Higher actual costs produce an adverse result; lower actual costs produce a favourable one. Breaking the difference into price, quantity, rate or efficiency effects helps show where the gap arose and supports accountability. Managers can use these findings to refine spending controls and inform future budgets.
For planning, a business planning consultant can help connect variance findings with future assumptions and priorities.
Material price and usage variances
Material price variance equals the actual quantity purchased multiplied by the difference between actual price and standard price. Material usage variance equals the standard price multiplied by actual quantity used minus the standard quantity allowed for the output achieved. These calculations distinguish paying more or less per piece from using more or fewer pieces than expected. For XYZ Company, actual use of 25,000 pieces compared with a standard of 18,000 signals an unfavourable quantity difference.
Labour rate and efficiency variances
Labour rate variance equals actual hours worked multiplied by the difference between actual and standard hourly rates. Labour efficiency variance equals the standard rate multiplied by actual hours minus standard hours allowed for output. Together, they separate wage-rate effects from time-use effects. In XYZ Company’s January example, labour cost was higher per hour than standard, and production used 1,000 more hours than standard, creating two distinct causes to investigate.
What’s the difference between a favourable and an adverse variance?
A favourable variance means the actual result was better for profit than expected; an adverse variance means it was worse. “Unfavourable” is another term for adverse. These labels describe the effect against the benchmark, not whether the result is automatically good or bad. For example, higher-than-budgeted sales revenue may be favourable, while higher-than-budgeted production costs may be adverse.
Interpret each result in relation to what is being measured. If a business sells more than planned at its budgeted price, the volume effect can support profit. If it pays more for materials than the standard rate, the price effect can reduce profit. A result below budget is therefore not always favourable: lower sales revenue can harm profit, even though the figure is below plan.
Context matters too. A manufacturer might buy cheaper materials and record a favourable price variance. If the materials are lower quality and cause more production waste, that saving may be offset by an adverse usage variance. Looking at purchase price alone would miss the operational impact. Compare related variances and consider their combined effect before judging whether performance improved.
For a useful review, identify the measure, compare actual performance with the budget or standard, then assess the effect on profit. A favourable labour-rate variance, for example, may coincide with an adverse efficiency variance if work takes longer than expected. The results can point to different causes, such as wage rates and time spent. Investigating their relationship gives managers a clearer basis for action than treating each label as a verdict.
Management’s use of variance analysis
Managers use variance analysis to identify where actual performance departs from plan and decide what needs attention. A monthly review turns those differences into questions about causes, accountability and action.
Investigating significant variances
Investigation means tracing an unusual or material difference to its underlying cause before deciding how to respond. Managers can compare it with related results, examine the transactions behind it and speak with the team responsible. For example, a sharp movement in a sales account may reflect changed activity, a recording error or another operational issue. The figures show where to look; evidence helps explain why.
Set materiality levels during the monthly close so teams can distinguish routine movements from changes that need follow-up. Management by exception focuses investigation on the largest or most unusual variances, rather than every small difference. A recurring adverse result may call for corrective action, while a one-off movement may need monitoring. Unusual discrepancies can also flag activity for further investigation, including potential fraud; a variance is a signal, not proof.
Advantages and limitations of variance analysis
Variance analysis supports cost control by showing where actual performance diverges from budget and helping managers target corrective action. Comparing results across departments can also make accountability more specific: a manager can assess a difference against the area and assumptions they oversee. Reviewing sales price and volume effects, for example, helps distinguish two sources of profit change rather than treating them as one result.
One limitation is timing: the analysis looks backwards and depends on the quality of the standards used. An outdated benchmark can make normal operating changes appear problematic or hide a genuine concern. A favourable figure can also mask a trade-off, such as cheaper materials contributing to waste. Pairing variance review with forward-looking analysis helps managers assess whether past patterns remain relevant to future decisions.
If variance findings aren’t translating into clear priorities, discuss strengthening your financial oversight.
PCFO: Finance Director Services
PCFO provides Finance Director Services for growing businesses that need to connect financial reporting with management decisions. If variances are being reported but their causes, ownership or implications for future plans remain unclear, PCFO can help bring a more strategic perspective to performance review.
Finance Director Services can help you assess how budget differences relate to business priorities, while Chief Financial Officer Services and Business Growth Advisory support wider financial leadership and growth planning. A Business Planning Consultant can help translate findings into practical assumptions for future plans. The right support depends on the challenge: interpreting results, strengthening financial oversight or preparing for growth.
To discuss how PCFO could support your business, contact the team.
Make each review inform the next decision
Variance analysis in management accounting should shape management’s next questions, not simply close a reporting period. Bring its conclusions into the next planning conversation: decide which assumptions still hold, which priorities have shifted and who will take each decision forward. As the business changes, keep the review focused on questions leaders can act on, rather than preserving a process simply because it has always been used. Clear ownership of follow-up helps make the analysis part of ongoing management, not an isolated report.
If interpreting results and turning them into direction has become a leadership challenge, PCFO offers Finance Director Services, Chief Financial Officer Services and Business Growth Advisory. This support can connect financial oversight with growth decisions and future planning, giving leaders a clearer basis for moving from analysis to action.
To discuss how PCFO can support your business, contact PCFO to discuss your needs. A clearer view of your figures can help you approach the next decision with confidence.
Frequently Asked Questions
What are the main types of variance?
The main categories are sales, materials, labour and overhead variances. Each focuses on a different source of performance movement: sales results concern revenue, materials relate to purchasing and use, labour covers workforce costs and time, and overheads concern indirect operating costs. Grouping results this way helps managers assign follow-up to the people closest to the activity, rather than treating every difference as a general cost issue.
What is variance analysis in management accounting?
Variance analysis in management accounting examines differences between planned and recorded financial performance. It can be applied across the income statement, balance sheet or cash flow statement, depending on the question management needs to answer. For example, a cash flow comparison may help explain why cash movements diverged from expectations, while an income statement review can focus attention on revenue or operating expenses.
What are the main types of variances in management accounting?
Common subtypes distinguish the source of a difference, rather than just its account category. A materials variance can separate purchase-price effects from usage; a labour variance can distinguish wage-rate effects from time worked. Sales analysis may separate price from volume, while fixed overhead analysis distinguishes spending from activity levels. This breakdown helps managers avoid attributing a combined result to the wrong operational cause.
How do you calculate variable and fixed overhead variances?
For variable overhead, compare actual spending with the standard overhead allowed for the actual hours worked, then assess efficiency separately by comparing actual hours with standard hours for output. For fixed overhead, compare actual fixed costs with the budget to identify the spending difference. Assess the volume variance by comparing budgeted and actual activity and the overhead absorbed by production.
What is the difference between favourable and adverse variances?
A favourable variance improves profit relative to the benchmark, while an adverse variance reduces it. The direction depends on the measure: higher revenue than planned may help profit, but higher operating costs may harm it. Consider linked results before judging performance. For instance, a saving in one cost category may coincide with increased waste elsewhere, so the overall business effect matters more than a single favourable label.
How does standard costing support variance analysis?
Standard costing gives managers a consistent reference for assessing the resources expected for each unit of output. Standards can specify expected material quantities, labour time and overhead rates, allowing actual performance to be compared on a like-for-like basis. Their usefulness depends on how well they reflect current production methods and operating conditions. Reviewing standards as the business changes keeps comparisons relevant to decisions.