

What if your new product reaches its break-even sales target on paper, but still puts pressure on cash before customers pay? A break-even analysis for a new product launch can show how many units you need to sell to cover launch costs. The result is useful only if its assumptions reflect the commercial and cash-flow realities of your business.
It’s understandable to want one clear sales target before committing to production, marketing or distribution. The challenge is deciding which costs belong in the calculation and turning contribution per unit into a target you can compare with realistic demand. This guide explains how to calculate break-even sales volume and revenue, then test how the result changes when price, costs or sales expectations shift.
You’ll also learn how to interpret the result alongside cash timing and launch risk, and use it to set practical thresholds for proceeding and monitoring performance. Break-even is not a one-off answer or a guarantee of success. It’s one planning tool, strengthened by ongoing forecasting and financial oversight, that can help you make a more informed launch decision.
Key Takeaways
- Use break-even analysis for a new product launch to set the minimum sales hurdle, based on relevant fixed costs and contribution per unit.
- Calculate the unit target by dividing fixed costs by the amount each sale contributes after variable costs.
- Compare base, downside and upside scenarios to see how changes in price, costs and demand could shift the target.
- Check whether the sales volume is achievable within your chosen timeframe and your production, distribution and team capacity.
- Turn the result into a monitored launch plan, with clear owners, review dates and measures for tracking performance.
What break-even analysis tells you before launching a new product
Before committing to a launch, establish the minimum sales hurdle. Break-even analysis estimates the point at which revenue from the product covers the costs included in your calculation. The Break-even point is a useful foundation, but a launch decision also depends on which costs you include, the period you assess and whether the target is commercially achievable.
Define the scope first. Potential costs might include product development, initial production, packaging, launch marketing and other spending directly associated with bringing the product to market. Decide how to treat shared overheads, such as existing staff time, and avoid counting the same cost twice. A monthly break-even target answers a different question from one covering the full launch period, so state the timeframe alongside the result.
What does break-even mean for a new product?
At break-even, the contribution generated by sales has covered the costs included in the analysis. Contribution is the amount left from selling a unit after deducting its variable costs. You can express the threshold as a unit volume or as revenue. For example, a hypothetical product selling for £20 with £10 contribution per unit would need 1,000 units to cover £10,000 of included fixed costs, equivalent to £20,000 in sales revenue.
That result is not a profit target. It also doesn’t show when you’ll recover an upfront cash investment, as a payback assessment does, or whether you’ll have enough cash available when bills fall due. You could reach the calculated sales threshold and still face cash pressure if you pay suppliers before receiving customer payments.
Which launch decision can the analysis inform?
Use the threshold to inform pricing, production quantities and how much launch investment to commit. Compare the required sales with expected demand over the chosen period, as well as the volume your production, distribution and sales teams can handle. If the target exceeds realistic demand or capacity, revisit the assumptions before committing further resources.
Break-even shows when a product covers the costs in your calculation; profitability means it generates a surplus beyond those costs. The distinction matters: reaching break-even doesn’t prove that the product will meet your wider return expectations.
A break-even analysis for a new product launch is a planning estimate, not a promise of sales. Its value depends on the assumptions behind price, variable costs, launch spending and demand. Treat it as one input to a wider forecast, then compare actual results with those assumptions as the launch progresses.
How to calculate break-even for a new product launch, step by step
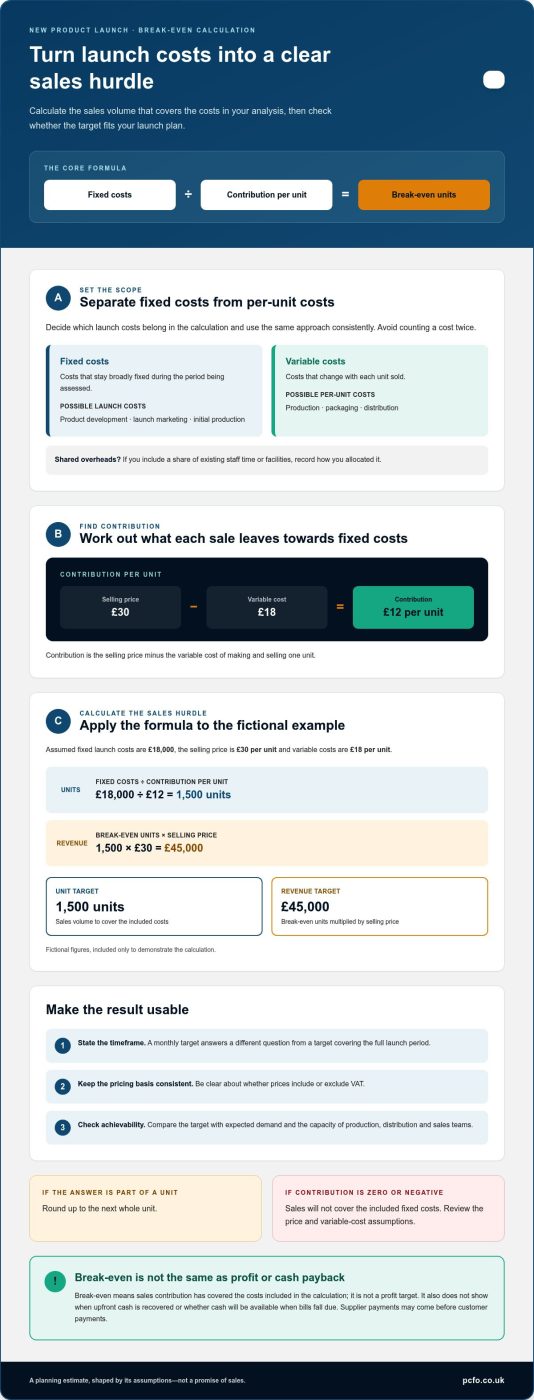
A reliable calculation starts with clearly defined costs, a consistent pricing basis and a set period. The core formula is:
Break-even units = fixed costs ÷ contribution per unit
Contribution per unit is the selling price minus the variable cost of making and selling one unit. To calculate break-even revenue, multiply the break-even units by the selling price. These figures give you a unit target and a revenue target to compare with your launch plan.
Classify launch costs before using the formula
Separate costs that stay broadly fixed during the period from costs that change with each unit sold. Relevant costs could include product development, launch marketing, production, packaging and distribution. Set a clear scope so you don’t count the same cost twice. If you include a share of existing overheads, record how you allocated it, such as by the product’s use of staff time or facilities. Apply the same approach consistently.
Calculate contribution and break-even sales volume
Consider this fictional example, provided only to demonstrate the calculation. Assume fixed launch costs of £18,000, a selling price of £30 per unit and variable costs of £18 per unit. Contribution is £12 per unit. Dividing fixed costs by contribution gives the break-even volume. Multiplying that volume by the selling price gives the break-even revenue.
| Input or output | Calculation | Result |
|---|---|---|
| Contribution per unit | £30 − £18 | £12 |
| Break-even units | £18,000 ÷ £12 | 1,500 units |
| Break-even revenue | 1,500 × £30 | £45,000 |
If the formula produces part of a unit, round up to the next whole unit. A low contribution means you’ll need to sell more units to cover fixed costs. If contribution is zero or negative, sales won’t cover those costs, so review your price and variable cost assumptions before relying on the result.
Make the result useful to decision-makers
State the assumptions and timeframe alongside the result, for example, “1,500 units over the first six months, at the assumed price and cost per unit.” Be consistent about whether prices include or exclude VAT. Then compare the target with expected demand, available capacity and the wider business plan. A strategic business planning approach can help put the calculation in context. For support building launch assumptions into a plan, explore PCFO’s business planning support.
Stress-test your product launch break-even point with realistic scenarios
A single break-even figure can hide how sensitive the result is to price, costs and demand. Build base, downside and upside cases, changing the assumptions deliberately so you can see which conditions make the launch more or less viable. The figures below are fictional and illustrate the method only, not a forecast or typical market outcome.
Which assumptions should a launch team test?
Start with the variables most likely to shift. Test whether discounts or a lower selling price reduce contribution, and whether supplier, production, fulfilment or customer acquisition costs could rise. Also vary fixed launch spend. Then compare forecast sales with the volume you can actually produce, hold in stock, distribute and sell during the period. A demand estimate isn’t achievable if supply or channel capacity limits fulfilment.
| Scenario | Price per unit | Variable cost per unit | Fixed launch costs | Break-even volume | Illustrative sales plan |
|---|---|---|---|---|---|
| Base | £40 | £22 | £27,000 | 1,500 units | 1,800 units |
| Downside | £36 | £25 | £30,000 | 2,728 units | 2,100 units |
| Upside | £42 | £21 | £25,200 | 1,200 units | 2,000 units |
Break-even volume is fixed costs divided by contribution per unit, rounded up to a whole unit. In the downside case, a lower price, higher unit costs and greater launch spend combine to push the target above the illustrative sales plan. The base and upside cases are above break-even, but only if demand and delivery capacity support the assumed sales.
How should you interpret a margin of safety?
Margin of safety is the gap between forecast sales and break-even sales, measured here in units. The base case has a 300-unit margin; the downside case falls 628 units short. A smaller positive gap leaves less room for forecast error, but there’s no universal threshold that suits every launch. Consider the forecast’s reliability, the time period and the consequences of missing the target. Yale’s primer on break-even analysis offers further context on using the method to assess investment decisions.
Sensitivity analysis tests how your assumptions affect the result, not whether any scenario is certain to happen. A break-even analysis for a new product launch is most useful when assumptions are visible and updated as evidence changes.
When can planning software or expert analysis help?
If changing one assumption affects several linked forecasts, maintaining versions in spreadsheets can become difficult. A structured planning approach can help keep scenarios consistent and make comparisons easier. For more on the trade-offs, read this guide to FP&A consultants versus software.
Use break-even analysis to decide whether your product launch is viable
A break-even target is useful only if it can be reached within a defined period. Compare the required sales volume with credible demand, production and distribution capacity, and the time needed to build sales. A target that appears achievable over a year may be unrealistic within a shorter launch window. Treat the calculation as one input to commercial judgement, not as proof that customers will buy.
Does reaching break-even mean the launch is profitable?
Not necessarily. Break-even covers only the costs included in the calculation. Unit contribution shows what remains from each sale after variable costs, but it doesn’t represent overall business profit or account for costs and commitments outside the analysis. The time horizon matters too: a product might cover its included costs eventually, yet still miss the required return or timing for the business. Validate demand alongside the figures.
How should break-even analysis connect to cash flow?
Break-even compares revenue with costs; it doesn’t show when cash leaves or enters your account. You might pay for stock, production or launch spending well before customers pay for their orders. Payment terms and the timing of inventory purchases can therefore create cash pressure, even if expected sales meet the break-even target. Assess cash receipts and payments separately, using a forecast alongside the break-even analysis for a new product launch. For support connecting cash-flow assumptions with wider financial planning, explore PCFO’s business planning support.
What should a practical launch decision include?
Set out the break-even target, the assumptions behind it, the relevant time period and a downside scenario. Then agree what evidence will prompt the team to proceed, revise the plan, delay or stop. Decision gates might include validating demand before increasing production or reviewing costs before further launch spending. These are business-specific controls, not universal thresholds.
Assign an owner to review actual sales, prices, unit costs and launch spending against the plan at agreed intervals. Track variances and update the forecast when assumptions change. A single break-even figure shouldn’t automatically approve a launch; it should help decision-makers ask better questions about demand, delivery and available cash.
PCFO’s financial leadership and business planning support can help growing businesses turn launch assumptions into a tested, monitored decision. Explore PCFO’s business planning support.
Turn break-even analysis into a controlled product launch plan
Once you’ve tested the assumptions, make the analysis part of the launch plan rather than leaving it in a spreadsheet. Document the target, costs included, expected timing and downside case. Assign an owner to each key assumption and set review dates before launch. This gives the team a shared reference point and makes it easier to spot when actual performance calls for a change in course.
What should you monitor after launch?
Compare actual sales and contribution with the model, then investigate the reasons for any gap. Track selling prices, discounts, variable costs and relevant launch spending. Where they affect performance, include returns and channel results too. Choose reporting intervals that match the pace of the launch and the decisions you need to make. Update the model when market evidence or operating conditions change, rather than relying on assumptions that no longer fit.
When can a Finance Director strengthen the analysis?
Financial leadership can challenge the assumptions behind the break-even analysis for a new product launch and connect them to wider planning, forecasting and performance monitoring. A Finance Director can help the team understand what is driving variances and weigh options such as adjusting price, spend or production plans. Read more about the strategic role of a Finance Director. No calculation can guarantee commercial success, but disciplined review can support clearer decisions.
What is the next step for a growing business?
Bring together your cost, pricing, volume and timing assumptions, along with the person responsible for reviewing each one. This gives planning conversations a practical starting point, whether you’re refining the launch case or preparing to monitor results. A tested model offers structure, not certainty. It helps you see what needs to be true for the launch to work and respond thoughtfully as real evidence emerges.
If you’d like support connecting launch assumptions to a broader financial plan, discuss product launch planning with PCFO.
Make your next launch decision with confidence
A break-even analysis for a new product launch gives you a practical sales threshold, provided the costs, pricing assumptions and timeframe are clearly defined. Test that threshold against downside scenarios, realistic demand and delivery capacity. Then consider cash timing separately, and keep comparing actual results with the plan as the launch develops.
Break-even is a decision-making tool, not a guarantee of commercial success or an automatic reason to proceed. Used alongside forecasting and market evidence, it can help you identify where assumptions need attention and when to adjust course.
PCFO provides fractional and outsourced CFO and Finance Director services, alongside business planning and growth advisory support for growing businesses. Discuss your product launch planning with PCFO and turn your assumptions into a plan you can monitor and refine. With clear inputs and regular review, you can approach the next decision with greater clarity.
Frequently Asked Questions
How do you calculate break-even for a new product launch?
Divide the fixed costs included in your analysis by the contribution earned from each unit sold. Contribution per unit is the selling price minus the variable cost per unit. For a break-even analysis for a new product launch, first define the costs and time period you’re assessing, then use consistent assumptions for price and costs. If the answer includes part of a unit, round up to the next whole unit.
What costs should be included in a product launch break-even analysis?
Include relevant fixed launch costs, such as product development or launch marketing, and variable costs that change with each sale, such as materials, packaging or fulfilment. Consider production and distribution costs too. Decide whether to include a share of existing overheads, explain how you allocate it, and avoid counting any cost twice. The right cost set depends on the decision you’re assessing and the period covered.
Can a product reach break-even without being profitable?
Yes. Break-even means revenue has covered the costs included in the calculation, not every cost or commitment across the business. A product may have positive contribution per unit but still not cover shared overheads, financing costs or other expenses excluded from the analysis. The period also matters: reaching break-even later than the business can support may not meet its commercial objectives. Treat the result as one measure of viability, not a profit guarantee.
How do you calculate break-even sales in units and revenue?
Calculate break-even units by dividing fixed costs by contribution per unit. Then multiply those units by the selling price to find break-even revenue. For example, with £12,000 in fixed costs, a £25 selling price and £15 variable cost per unit, contribution is £10. Break-even is 1,200 units, or £30,000 in revenue, assuming the price and costs remain consistent across the sales period.
What happens if the break-even sales target is unrealistic?
Don’t treat an unattainable target as an instruction to proceed anyway. Check whether the assumptions can change: review pricing and discounts, unit costs, launch spending and the sales period. Compare the revised target with credible demand and production, distribution and sales capacity. If the gap remains too large, consider revising the launch plan, delaying commitments or stopping before further investment. Commercial validation should inform the decision.
How does break-even analysis differ from cash-flow forecasting?
Break-even analysis identifies the sales level at which revenue covers the costs included in the calculation. Cash-flow forecasting tracks when money is expected to enter and leave the business. A launch might meet its break-even target but still face a cash shortfall if stock, production or marketing bills are paid before customers pay. Use a cash-flow forecast to assess payment timing, alongside break-even analysis for the sales threshold.
Should a new product launch use a break-even analysis or a forecast?
Use both, as they answer different planning questions. Break-even analysis shows the sales level needed to cover specified costs; a sales forecast estimates what you may sell over a defined period, based on your assumptions and evidence. A cash-flow forecast adds the timing of receipts and payments. Comparing these views helps you assess whether the target is achievable, what resources are needed and when to review or adjust the plan.