

Finance isn’t just a report for the board. It’s a practical guide to decisions across the business. To explain company finances to non-finance employees, connect the numbers to day-to-day choices, using plain language and relevant examples. This helps colleagues see how their work affects costs, revenue and business priorities.
Profit and loss statements, cash flow and financial jargon can feel far removed from operational work. The aim is to make the information useful, not to turn every employee into an accountant. These practical approaches show how to explain financial results, choose clear charts and KPIs, and link the numbers to team responsibilities. Employees can then use the information to plan, spot issues and make informed decisions.
Key Takeaways
- Link financial reports to business objectives so teams can see how everyday decisions affect company performance.
- Use plain language and clear visuals to make financial information easier to follow and discuss.
- Explain profit and loss by showing how turnover, costs and gross profit relate to one another.
- Choose charts according to the question: use trend lines for performance over time and waterfall charts to show what drove a change.
- Focus each team on a small set of relevant KPIs, then use the results to guide practical action.
1. Why is finance important for non-finance managers?
Financial awareness helps managers connect daily decisions with business objectives. A hiring plan, supplier choice or marketing campaign can affect spending, revenue and profits. Teams that can interpret financial reports are better placed to assess project returns and plan work around available resources. According to a Chartered Institute of Management Accountants (CIMA) survey, 80% of non-financial managers struggle to understand financial statements. Clear explanations can help close that gap and show how each department contributes to company performance.
When explaining a budget and variance to staff, begin with the planned amount for a department or activity, then compare it with actual spending. Describe the difference in plain language and connect it to an operational cause, such as a delayed project or a change in supplier costs. Ask managers what action the variance might call for instead of treating the figure as a score on its own. Building budgets from operational plans also helps employees understand the assumptions behind them.
Shape executive reports like a pyramid: start with the main conclusion or decision required, then explain the key financial drivers, followed by supporting figures and detailed schedules. For example, a report might lead with a project’s lower-than-planned return, explain the revenue and cost factors, then provide transaction-level detail in an appendix. Senior readers can grasp the message quickly, while financial managers have the evidence to investigate.
Companies should communicate financial results regularly, not only when a target is missed. Quarterly reviews can build trust and give finance professionals opportunities to contribute to business discussions. In those reviews, compare actual performance with objectives, explain important changes and invite questions from department leads. A rolling 3-month forecast can also help teams consider upcoming spending and revenue contributions, then adjust plans as conditions change.
A dashboard brings selected measures together in a format teams can use. Jeanne Bell advocated dashboards that track performance indicators for the organisation and each department, using red for action, yellow for monitoring and green for celebration. Choose indicators linked to business objectives, such as progress against a sales plan or control of departmental spending. Show the trend, explain what caused it and identify the next decision, so the status is meaningful.
Effective financial literacy training involves practical participation, not just presentations. Ask staff to review a simple departmental budget, identify a variance and discuss how a proposed change could affect cash flow. Build knowledge gradually, starting with everyday terms before introducing reports such as the balance sheet. Feedback after each session can show which explanations employees can apply and where they need more practice.
2. What visuals work best for non-financial audiences?
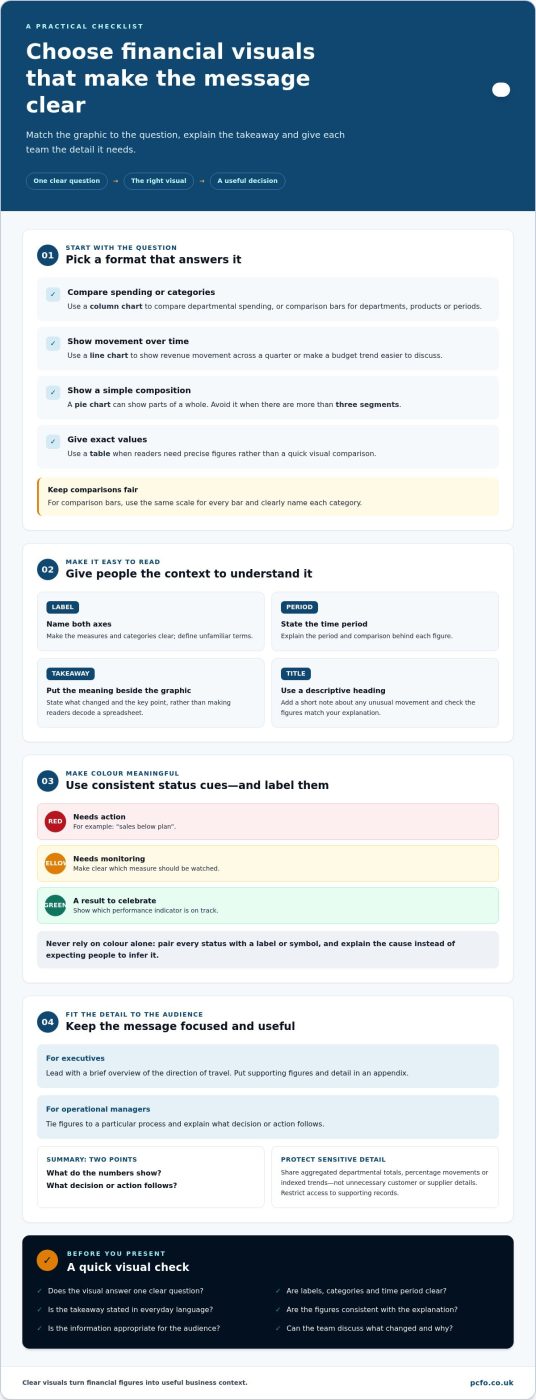
Choose a visual that answers one clear question, then explain it in everyday language. A column chart, for example, can compare departmental spending, while a line chart can show revenue movement across a quarter. Label each axis, define unfamiliar terms and state the takeaway beside the graphic. Employees can then see what changed without having to decode a dense spreadsheet.
Match the format to the audience. Executives may need a brief overview of the direction of travel, while operational managers may need figures tied to a particular process. A concise summary can cover two points: what the numbers show and what decision or action follows. Put supporting detail in an appendix for colleagues who want to examine the underlying figures.
Use comparison bars when teams need to compare departments, products or periods. Give every bar the same scale and clearly name the categories so readers can interpret the difference. Pie charts can show a simple composition, but avoid them when there are more than three segments. A table may be clearer when readers need exact values rather than a quick visual comparison.
Colour can draw attention when its meaning is consistent. A dashboard might use red for a measure that needs action, yellow for one to monitor and green for a result worth celebrating. Pair each colour with a label or symbol so the meaning does not depend on colour alone. Add a short explanation, such as “sales below plan”, rather than expecting employees to infer the cause from red.
To make financial presentations engaging for non-finance teams, build them around a relevant example and invite staff to interpret the visual. Show a budget trend, ask what changed, then discuss how a team decision could affect the next quarter. Keep slides concise, with one message and clearly visible data points. This makes the discussion participatory rather than a sequence of figures read aloud.
Share the financial measure employees need, not every underlying transaction, to present performance without exposing confidential details. For instance, use aggregated departmental totals, percentage movements or indexed trends instead of naming individual customers or suppliers. Explain the period and comparison behind each figure, and restrict access to supporting records. This gives employees useful context without unnecessary sensitive detail.
Excel or Power BI can help create charts, graphs and infographics that make financial trends and metrics easier to see. Give each visual a descriptive title, a clear time period and a short note about any unusual movement. Before presenting it, check that the chart supports the intended conclusion and that the numbers match the accompanying explanation.
If your reporting needs a more consistent structure, consider financial leadership support to help connect financial information with business decisions.
3. Understanding income statements and profit and loss
Explain the three main financial statements by giving each a distinct purpose. An income statement, often called a profit and loss statement, shows income and expenses over a period. A balance sheet shows what the company owns and owes at a particular point in time. A cash flow statement tracks money moving into and out of the business. Together, they connect performance, resources and cash.
To explain basic financial statements to non-finance employees, start with the income statement and trace how turnover becomes profit. For example, a company with annual turnover of £150,000 and cost of sales of £70,000 has gross profit of £80,000. The gross profit margin is about 53%, calculated by expressing gross profit as a percentage of turnover. Explain that this figure is before overheads, so it isn’t the company’s final profit.
Use the same example to explain revenue, costs and profit in everyday language. Revenue is money earned from sales; cost of sales is the direct cost of providing those goods or services. Gross profit is what remains after those direct costs, while overheads cover other business expenses. This shows how income is earned and where it goes, making the role of each cost easier to understand.
A balance sheet answers a different question: what is the company’s financial position now? Its basic equation is assets = liabilities + shareholders’ equity. Assets are resources the business owns or controls, while liabilities are amounts it owes. Current assets are expected to be used, sold or turned into cash within one year; current liabilities are debts due within one year. This helps employees understand why a profitable business still needs to manage its debts and available resources.
Explain cash flow separately because profit and cash are not interchangeable. A cash flow statement shows money flowing into and out of a business. A sale recorded as income does not necessarily mean the cash has arrived, while bills may need to be paid before related customer receipts come in. Ask teams to consider when money is received and paid, not just whether a sale or expense appears in the accounts.
Help staff interpret financial statements by taking a practical decision and connecting it to the relevant numbers. A product team might compare gross profit margins across product lines; an operations team might consider how stock levels affect cash tied up in the business. Explain what each statement can reveal, then invite employees to identify a question it helps answer. This puts financial information in useful context for their work.
4. Choosing charts to match the question
Start with the question the team needs to answer, then choose a chart that makes the answer visible. A chart showing whether performance is improving needs a different structure from one explaining why a figure changed. This simple step keeps the visual focused and gives employees a clear path from data to decision.
Use a trend line to answer questions about the direction of financial performance. It can show whether sales, spending or cash flow is rising, falling or holding steady across reporting periods. Label the time periods and measure clearly, then explain the movement that matters most. If spending rises during a project, for example, discuss whether it reflects planned activity or a change that needs attention.
A waterfall chart helps explain how a figure moved from its starting point to its final result. It can break a profit forecast variance into contributing changes, such as lower sales income and higher operating costs. Each step shows how a factor affects the total, giving employees a clearer explanation than the opening and closing numbers alone.
Before presenting a chart, prepare a short interpretation: what changed, what drove the movement and what decision follows. If a cash flow trend differs from the profit trend, explain that they measure different things. A useful chart supports the explanation; it does not replace the accounting detail needed to understand the result.
Questions are part of learning, so leave room for discussion after showing a chart. Ask employees what they notice, which operational event might explain the movement and what they would investigate next. A department lead, for example, may connect a rise in spending with a delayed supplier delivery. The discussion can surface useful context for finance teams.
Prepare for difficult questions by checking the underlying data and the assumptions behind your conclusion. If executives ask why a forecast changed, show the factors that informed the revision and explain how each affects the expected result. Support recommendations with data rather than relying on an unsupported explanation. If an answer needs further analysis, state what information will resolve it and return to the question with a clear response.
Make the chart useful after the meeting by including its title, reporting period, units and a brief note about the main trend. Keep detailed accounting schedules available for colleagues who need to examine the figures. This gives readers seeking the headline a clear overview while providing financial managers with supporting evidence.
Review the presentation after each discussion. Note which chart prompted useful questions, where employees misread a trend and which explanation clarified the issue. Use that feedback to improve the next report, adapting its visual and narrative to the audience. A considered chart choice makes financial discussions more focused and helps teams act on what the numbers show.
5. Making data accessible while focusing on relevant KPIs
Start with the decisions a team can influence, then select financial data that helps guide them. Work with finance to define 3-5 financial KPIs directly affected by the department’s work. A sales team might focus on revenue growth, while an operations team may track cost management. Explain each measure’s meaning, how it is calculated and which decisions can change it.
Not every employee needs a full company dashboard. If a role has one main financial responsibility, give that person one KPI to manage, with enough context to understand its effect. For example, a project lead could monitor spending against the approved budget and raise concerns when delivery plans change. Keep wider company results visible, but make the day-to-day measure specific to the role.
Which financial metrics should employees understand? Prioritise revenue growth, cost management, profitability ratios and cash flow when they relate to employees’ decisions. Each department should understand how its activity affects business performance rather than memorise figures without context. Explain the link between the team’s work and the chosen measure, then describe what a change could signal.
Make financial information accessible by breaking complex reports into manageable pieces. A one-page summary can present the KPIs, key observations, concerns, questions and action items. Put detailed calculations and supporting schedules in appendices for readers who need them. This gives busy managers a useful overview without hiding the evidence behind the financial data.
Make the message memorable with a short story about a real operational challenge. Explain how a delay affected delivery, which costs or income changed, and what the team can do differently next time. Use everyday language and an example from a specific department. A clear sequence of event, financial effect and action gives employees a practical way to remember the lesson.
For UK staff updates, share relevant, aggregated results and clarify which information is for internal use. Limit customer, supplier and individual transaction details to the people who need them for their work. This gives employees useful financial context without presenting every underlying record as general staff information.
Review the KPIs with employees and ask which measures help them make decisions. If a metric sits outside a department’s influence, replace it with one the team can affect. A finance leader can also use feedback to refine the summary and explain how actions connect to company goals. For support aligning reporting with business decisions, explore Finance Director Services.
PCFO: Finance Director Services
PCFO’s Finance Director Services help growing businesses turn financial reporting into clearer decisions and more useful conversations with their teams. This support can be valuable when managers need to connect budgets, forecasts and performance measures with operational priorities, or explain financial information consistently across departments.
For wider financial leadership, PCFO’s Chief Financial Officer Services support strategic planning and financial decision-making. Business Growth Advisory and Business Planning Services can also help owners assess growth plans and understand the financial implications of different choices. The aim is to make financial insight useful to the business, not simply produce reports.
To discuss how PCFO can support your business, book a free initial strategy session.
Build financial understanding into the way your business works
Explaining company finances to non-finance employees is an ongoing part of business communication, not a one-off presentation. Include financial understanding in planning conversations, project reviews and team decisions. As priorities shift, revisit which information helps employees take responsibility and contribute to the company’s direction.
For business owners, the next step is to consider whether current financial leadership gives teams the insight they need. PCFO offers Finance Director Services, Chief Financial Officer Services and Business Growth Advisory to support financial decision-making and business development. These services can help connect financial planning with the company’s growth priorities.
Contact PCFO to discuss your needs and explore how financial leadership could support your business. Clearer conversations can help your teams make informed decisions with greater confidence.
Frequently Asked Questions
Why is finance important for non-finance managers?
Finance helps managers judge the business effect of operational choices, not just whether a task is complete. A team considering a new supplier, for example, can weigh service quality against costs and delivery. Explaining company finances to non-finance employees also helps managers recognise when a project’s assumptions have changed, so they can raise the issue early and discuss practical adjustments with colleagues.
What is the Balance Sheet?
A balance sheet shows a company’s assets, liabilities and shareholders’ equity at a particular date. Managers can use it to understand where resources are tied up, such as in stock or unpaid customer invoices, and how the business is funded. Comparing balance sheets across reporting periods can prompt useful questions about changes in assets or amounts owed, rather than treating one snapshot as the whole story.
How can FP&A teams improve cross-functional communication?
FP&A teams can improve communication by involving department leads in planning assumptions before forecasts are finalised. A sales manager can explain expected customer demand, while an operations lead can flag supplier or capacity constraints. Bringing these inputs together helps teams understand why forecast assumptions differ. After sharing results, ask each department which information supported its decisions and what needs clearer context in the next planning discussion.
What are the challenges of delivering financial information?
Common challenges include unexplained accounting terms, too many figures and information that arrives after a decision has been made. Employees may also struggle to act on a metric they cannot influence directly. For example, a team given a company-wide margin target needs to understand which choices it can control. Clarify the measure’s meaning, timing and connection to the team’s work, then provide a way to ask questions.
What are the key principles of communicating financial information?
Make financial communication accurate, relevant to its audience and clear about the action it supports. State the reporting period and comparison, explain unfamiliar measures, and distinguish actual results from forecasts. A project update, for example, can identify the current position, explain the main driver of a change and name the decision needed. This gives employees enough context to respond without overwhelming them with unrelated detail.
What visuals work best for non-financial audiences?
Choose visuals to suit the task: a comparison bar chart can show differences between teams, while a simple table works for readers who need exact figures. Keep labels clear and highlight the point employees should notice. For instance, annotate a chart where a change in customer demand coincides with a shift in sales. Use colour consistently and include text labels so the meaning stays clear without colour.
How can you tailor financial explanations to different employee roles?
Start with the decisions each role makes, then choose financial measures that connect to them. A sales team may need to understand how discounts affect revenue, while procurement colleagues may focus on supplier terms and purchasing choices. People managers can consider the financial implications of staffing plans. Use examples from the department’s work, explain which choices it can influence, and provide wider company context when it helps employees make better decisions.