

A spreadsheet can be a practical way to build a forecast, but it can become a bottleneck when planning relies on scattered files and manual updates. The limitations of spreadsheets for financial forecasting are most apparent when several people use the same figures or forecasts draw on data from different business systems. Reconciling information then takes time away from analysing what it means.
Using Excel for budgeting and forecasting doesn’t automatically mean you need to replace it. Spreadsheets can suit focused tasks and straightforward models. The challenge is recognising when their flexibility no longer supports reliable, connected planning.
This article explains where spreadsheets remain useful, how version control, data integrity and scenario modelling can create risks, and why integration with accounting, ERP and CRM systems matters as a business grows. You’ll learn what to consider when deciding whether a spreadsheet still meets your forecasting needs or whether company-wide planning calls for a more connected approach.
Key Takeaways
- Use spreadsheets for focused, manageable forecasting tasks, and recognise when collaboration and manual updates start to complicate the process.
- Connect financial data across business systems to reduce reconciliation work and give decision-makers a clearer, more current view.
- Assess whether your forecasting model can handle multiple teams, larger datasets and changing business assumptions without relying on fragile links or specialist knowledge.
- Explore scenario modelling and review formulas carefully so forecasts can support decisions as conditions change.
- Consider Finance Director or CFO support when planning needs stronger coordination, clearer insight or a more scalable approach.
Spreadsheet data integrity and version control
Audit trails, governance and financial reporting become harder to manage when edits, formulas and approvals are spread across separate spreadsheet versions. A finance team may struggle to identify who changed a forecast, which assumptions were approved and whether reported figures use the latest data.
Manual Entry and System Integration
Manual entry means copying financial figures into spreadsheet cells instead of importing them directly from business systems. Each transfer creates another opportunity to enter a figure, date or category incorrectly.
Excel does not easily connect with other systems, so teams may spend time preparing data instead of analysing it. For example, a finance manager might copy actual sales from a CRM export and costs from accounting software into separate tabs. If either source changes, the forecast can become outdated before the next review.
FP&A software can import data directly from accounting, ERP and CRM systems. This can reduce repeated handling, although teams still need consistent categories and clear ownership of assumptions. A dynamic link is useful only when its source data and update process are understood.
Aggregation and Data Cleansing
Aggregation combines figures from different files or systems, while data cleansing standardises them before analysis. In Excel, this often involves copying data manually, aligning date formats, matching account names and removing duplicate rows.
Suppose regional teams use different labels for the same expense. Someone must reconcile those labels before comparing totals. A formula may then add the wrong range if a new row falls outside the selected cells. As workbooks grow, each cleaning step creates dependencies that another reviewer must understand.
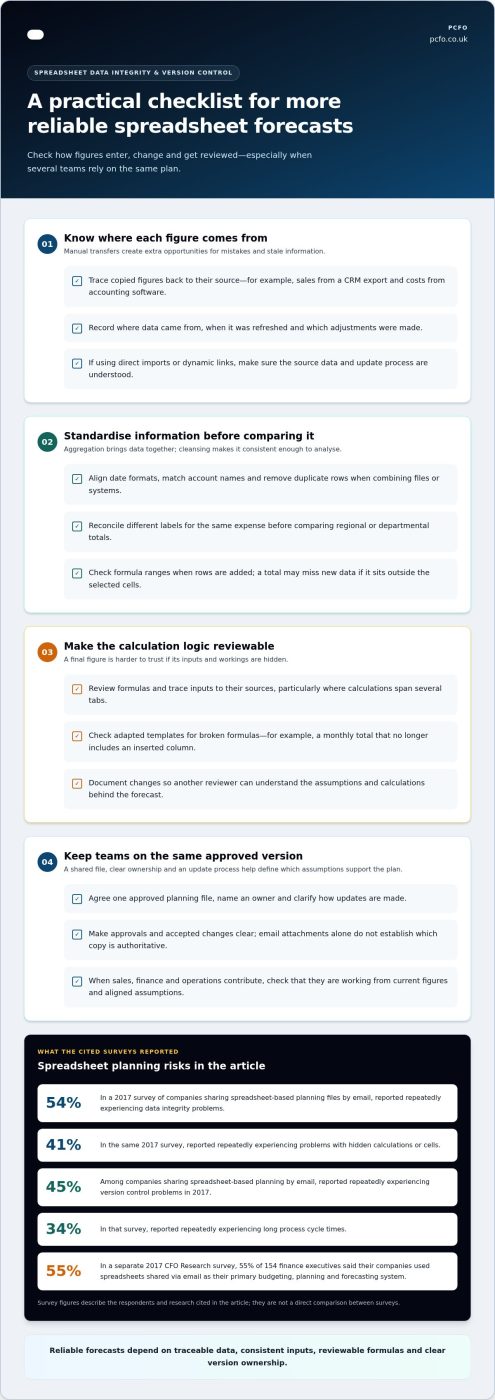
In a 2017 survey of companies sharing spreadsheet-based planning files by email, 54% reported repeatedly experiencing data integrity problems. That result highlights why a clear source for each figure matters. Recording where data came from, when it was refreshed and which adjustments were made gives reviewers a stronger basis for assessing a forecast.
Spreadsheet Errors in Financial Forecasts
Spreadsheet errors are mistakes in entered data, formulas or assumptions that change forecast results. Even a small input error can flow through linked calculations and affect projected revenue, cash flow or costs.
Complex formulas can be difficult to inspect, especially when cells are hidden or calculations depend on several tabs. In a 2017 survey of companies sharing spreadsheet-based planning files by email, 41% reported repeatedly experiencing problems with hidden calculations or cells. A reviewer may see the final figure without seeing the logic behind it.
Adapted templates can also carry broken formulas into a new forecast. For example, inserting a month into a table may leave a total that excludes that column. Reporting from complex workbooks can take substantial manual effort and remains prone to errors. Reviewing formula ranges, tracing inputs to their sources and documenting changes helps uncover problems before figures inform decisions.
Still Using Excel for Budgeting and Forecasting?
Collaborative planning requires finance and operational teams to work from the same assumptions. With Excel, email attachments and separate departmental files can turn one budget into competing versions.
A Single Source of Truth
A single source of truth is one shared, up-to-date set of planning data that teams use for decisions. Without it, finance, sales and operations can build forecasts from different versions of revenue, costs or hiring assumptions.
For example, sales might update its pipeline forecast while finance uses last week’s figures. Agreeing on one approved file, a named owner and an update process clarifies which assumptions support the consolidated plan. It also gives managers a consistent basis for comparing departmental submissions.
In a 2017 CFO Research survey, 55% of 154 finance executives said their companies used spreadsheets shared via email as their primary budgeting, planning and forecasting system. Email can distribute a file, but it doesn’t establish which attachment is authoritative.
Real-Time Collaboration and Version Control
Real-time collaboration lets contributors update shared planning information without passing separate copies between teams. Delayed updates can leave decisions based on figures that have already changed.
Collaboration in Excel can become difficult when several people edit, save and circulate files. The research states that only one person can make changes to an Excel spreadsheet at once. Even when teams can co-author files, unclear ownership and parallel copies can complicate review.
Among surveyed companies sharing spreadsheet-based planning by email, 45% reported repeatedly experiencing version control problems in 2017. A filename such as “Budget final” may not show whether it includes the latest sales assumptions or finance approval.
Email-based approvals create another hand-off. A department head may return a workbook with revised recruitment plans while finance has already consolidated an earlier attachment. Without a clear workflow, the finance team must compare copies, resolve conflicting inputs and record which changes were accepted.
The same survey found that 34% of these companies repeatedly experienced long process cycle times. That delay can consume time intended for analysis, especially when each department waits for another team’s workbook before updating its own forecast. A defined submission date, input owner and approval stage make responsibility easier to follow.
Effective collaboration also means agreeing how assumptions move between business units. Sales can provide expected deal timing, operations can update delivery capacity, and finance can incorporate both into the forecast. If each team submits data in a different format, consolidation takes more manual work and comparisons become harder.
In the 2017 survey, 78% of respondents expected pressure on finance functions to increase substantially to facilitate improved collaboration among key decision makers over the next 12-18 months. A structured planning process can make those contributions clearer. If shared forecasting needs stronger coordination, financial planning support can help bring the process into focus.
Excel’s suitability for individual finance tasks versus company-wide forecasting
Excel can work well for a focused model, such as projecting one department’s costs from a short list of assumptions. Company-wide forecasting is different: it must bring together multiple stakeholders, data sources and connected plans.
For UK businesses, spreadsheets may use software the company already has, while dedicated forecasting software brings licensing and implementation costs. Compare the full cost of each approach, including staff time spent preparing data, maintaining models, supporting users and integrating systems.
For a small or mid-sized company, Excel can support budgeting when one finance lead owns the model and other teams provide defined inputs. A simple cash flow forecast, for example, can map expected customer receipts against supplier payments. Its value depends on clear assumptions and timely updates. If actual payment timing changes, the forecast must reflect that to remain useful for decisions. This is equally true in specialised settings such as community associations, where professional oversight from My Arizona HOA Manager demonstrates how dedicated financial management can streamline reserve planning and prevent spreadsheet errors.
Company-wide planning adds complexity. Excel is two-dimensional, while financial planning can involve analysis across departments, products, locations and time periods. Linked workbooks may become harder to maintain as datasets grow. Reporting across several sources can also require substantial manual effort, particularly when stakeholders use different categories or planning periods.
Dedicated FP&A software offers an alternative for budgeting and forecasting across multiple scenarios. It can import data from accounting, ERP and CRM systems, reducing the need to assemble every input manually. This can help teams compare outcomes using shared assumptions, although the software still depends on well-managed source data and a planning process people follow.
Excel may remain suitable for some organisations when its controls fit their needs. The research states that Excel’s cell-locking and rule-setting functionality can meet the planning needs of businesses with around 1,000 employees. That is a capability, not a universal threshold: model complexity, number of contributors and links between files also shape whether the process remains manageable.
Survey findings underline the gap between familiarity and suitability. In 2017, only 6% of surveyed executives at companies using spreadsheets for budgeting, planning and forecasting were very satisfied with that choice. In the CFO Research and Planful survey, 58% of finance executives at companies sharing spreadsheets by email said their teams used spreadsheets for tasks that should use more sophisticated solutions.
Use Excel when a model has a clear owner, limited inputs and outputs that stakeholders can review. Consider dedicated software when several business units need connected forecasts, repeated scenario comparisons or data from multiple systems. Base the decision on how budgeting works in practice, not simply which tool the finance team already knows.
Forecasting accuracy and scenario modelling
A forecast is useful only when its assumptions reflect changing business conditions. Scenario analysis helps compare possible outcomes, but spreadsheet models can make those comparisons harder to update and maintain.
Predictive Modelling and Scenario Analysis
Predictive modelling uses historical and current data to estimate future financial outcomes, while scenario analysis compares results under different assumptions. Both matter because a single forecast can hide how sensitive cash flow or profitability is to changing conditions.
Excel can model projections with formulas, but its predictive modelling and scenario analysis capabilities are limited unless supplemented with external plugins or tools. For example, a business might examine how changing customer demand affects revenue and cash requirements. The model’s usefulness depends on sound inputs and clear assumptions, not just the calculation method.
Scenario Planning and What-If Analysis
Scenario planning sets out plausible future conditions, while what-if analysis adjusts specific assumptions to see how results change. A business can use both to understand the effect of delayed customer payments, higher supplier costs or a shift in sales demand.
In a spreadsheet, each alternative may require changing assumptions, copying tabs or maintaining separate versions. These steps can make comparisons harder if formulas differ between scenarios. Keep variables explicit: identify the assumption being changed, preserve the other inputs and compare the resulting cash flow or profit forecast. This makes the analysis easier to explain to decision-makers.
Automating Scenario Analysis
Automation applies consistent inputs and calculations across scenarios, reducing repeated manual adjustments. This matters when finance teams need to refresh forecasts as actual results or business assumptions change.
Excel can use formulas and linked worksheets to calculate different cases, but complex models can take specialist knowledge to maintain. An edit to a formula or input link may affect several outputs. FP&A software can support forecasting across multiple scenarios, helping teams apply shared assumptions more consistently. Automation still relies on accurate source data and a clear definition of each case.
Scenario Forecasting
Scenario forecasting combines a financial projection with a defined set of future assumptions. It helps leaders compare a central outlook with alternative conditions instead of treating one estimate as certain.
For example, a company could model a delayed project alongside its expected delivery plan, then review the effect on income and cash requirements. According to the American Productivity & Quality Center, budget assumptions are useless just three months after the budget year begins at 55% of companies. Reviewing assumptions against actual performance helps keep a forecast relevant.
To make scenario work useful for decisions, document the trigger for each case, the assumptions that change and the financial measures to review. External advisory specialists, such as True North Lifestyle, can help structure this analysis when scenario planning needs to inform wider company decisions and long-term financial strategy.
How do spreadsheet errors affect financial forecasts, and how common are they?
A spreadsheet error can distort a forecast when an incorrect input or formula flows into later calculations. For example, if a cost is entered in the wrong period, monthly cash requirements may appear lower than expected. That can affect hiring, spending or funding decisions based on the forecast. The risk grows when one figure feeds several linked tabs, as the original mistake may not be obvious in the final summary.
Formula errors can be difficult to detect in complex workbooks. A copied formula might omit a newly added row, use the wrong cell reference or apply an outdated assumption. A template adapted for a new forecast can also carry errors into calculated fields. The output may still look plausible, so reviewers need to understand how the calculation was built, not just whether the total seems reasonable.
In a 2017 survey of companies using spreadsheet-based budgeting, planning and forecasting shared by email, 37% reported repeatedly experiencing output errors. This figure describes surveyed companies using that process, not every spreadsheet or business. It illustrates why repeated errors deserve attention: an inaccurate forecast can make actual performance harder to compare with expectations.
The impact depends on where an error enters the model. An incorrect sales assumption can alter projected revenue, while a broken formula in a cost schedule can affect profit and cash flow. If the same error is copied into a management report, decision-makers may rely on the wrong result without seeing its source. Reporting from complex Excel workbooks also takes manual effort and can introduce further mistakes during transfer.
Reviewing a forecast is more effective when checks follow the flow of its calculations. Trace important figures back to their sources, inspect formulas that drive headline outputs, and compare current results with the previous forecast. For example, a sharp change in projected cash should be explained by an updated assumption or actual result. Documenting the reason makes later reviews clearer.
- Check that formula ranges include every relevant row and period.
- Compare key totals with source data and prior forecast versions.
- Record the assumption behind each material change.
These checks help reveal where errors enter, but they also depend on clear ownership and time for review. If spreadsheet outputs are difficult to explain or validate, discuss Finance Director Services to strengthen financial oversight and forecasting review.
PCFO: Finance Director Services
PCFO provides Finance Director Services for businesses that need clearer financial oversight and more useful forecasting. If spreadsheet models are difficult to maintain, or forecasts don’t give decision-makers a shared view of performance, experienced financial leadership can bring assumptions, reporting and planning into focus.
PCFO also offers Chief Financial Officer Services, Business Growth Advisory and Business Planning Consultant support. These services help business owners connect financial forecasts with wider operating plans and growth decisions. The right support depends on the challenge: a business may need stronger forecast reviews or a more connected approach to planning across teams.
To discuss your forecasting needs, contact PCFO.
Build a forecasting approach that can grow with your business
Recognising the limitations of spreadsheets for financial forecasting is a starting point, not a decision to replace every workbook. The useful next step is to define what your planning process must support as the business changes: who owns assumptions, how leaders use forecasts, and how financial insight informs growth decisions.
That clarity helps you decide whether to refine existing spreadsheets, connect them to business systems or adopt a more structured planning approach. It also gives finance and leadership teams a shared basis for discussing priorities, rather than focusing on software alone.
PCFO offers Finance Director Services and Chief Financial Officer Services for businesses seeking financial leadership, alongside Business Growth Advisory to connect planning with strategic decisions. These services can help you assess the role forecasting should play in your next stage of growth.
Contact PCFO to discuss your forecasting needs and take a considered next step towards planning with confidence.
Frequently Asked Questions
Is it Time to Step Up from Spreadsheets?
Consider changing your approach when spreadsheet administration delays decisions or leaves managers unsure which figures to use. For example, if a board meeting is postponed while finance reconciles conflicting departmental submissions, the planning process may need redesign. Review how long forecast updates take, who can explain the calculations and whether leaders can explore new assumptions without rebuilding the model. These signals matter more than company size alone.
What are the main limitations of spreadsheets for financial forecasting?
The main limitations of spreadsheets for financial forecasting are their reliance on people to maintain inputs, calculations and model structure. A workbook can produce a plausible result even when an assumption is out of date or a formula no longer reflects the business. Decision-makers need to understand what drives a projection and how changes in customer demand, staffing or supplier terms affect it.
Why are spreadsheets difficult to scale for complex financial forecasting?
Spreadsheets become harder to scale when a forecast depends on connected assumptions across departments, products and reporting periods. For example, a sales change may affect staffing needs, delivery capacity and cash requirements. Each relationship adds logic that must be maintained and explained. As contributors and data sources grow, finance can spend more time preserving the model than assessing what the latest forecast means for business decisions.
What are the risks of spreadsheet version-control and collaboration issues?
Version-control problems can leave teams acting on different assumptions without realising it. A department might approve a hiring plan in one workbook while finance consolidates an earlier submission. Changes must then be traced before managers can rely on the combined forecast. A clear owner, agreed approval route and record of accepted changes help teams establish which inputs shaped a decision.
How well do spreadsheets handle scenario planning and rolling forecasts?
Spreadsheets can model alternative cases and rolling forecasts, particularly when a finance specialist maintains the assumptions and formulas. The process becomes less efficient if every update requires copying tabs or rebuilding calculations. For a rolling forecast, teams need to replace elapsed periods with actual results, extend the outlook and review assumptions together. Dedicated planning software can support multiple scenarios and connected updates.
What are the security and data-integrity risks of spreadsheet-based forecasting?
Spreadsheet risks include accidental changes, unclear access and sensitive figures being shared beyond their intended audience. Email attachments can also remain in circulation after a newer file is created. Basic Excel files don’t provide the stringent security measures needed for sensitive financial information. Businesses should consider who can view or change forecast data, how copies are shared and whether the working file has controlled access.
How do spreadsheets compare with dedicated FP&A software for forecasting?
Spreadsheets offer flexible, familiar tools for individual calculations and smaller models. Dedicated FP&A software is designed to support broader planning, including scenario forecasting and data imports from accounting, ERP and CRM systems. The practical question is whether the current process lets stakeholders submit, review and use information efficiently. The right approach depends on the complexity of your planning and how teams use forecast outputs.
When should a UK business move from spreadsheets to dedicated forecasting software?
A UK business should consider dedicated forecasting software when spreadsheet maintenance no longer supports the decisions leaders need to make. Look for recurring delays in consolidating inputs, difficulty comparing business-unit plans or forecasts that are hard to refresh after actual results arrive. Map the decisions the forecast must inform, the systems supplying data and the people contributing assumptions. This assessment helps identify whether software addresses a real planning need.