

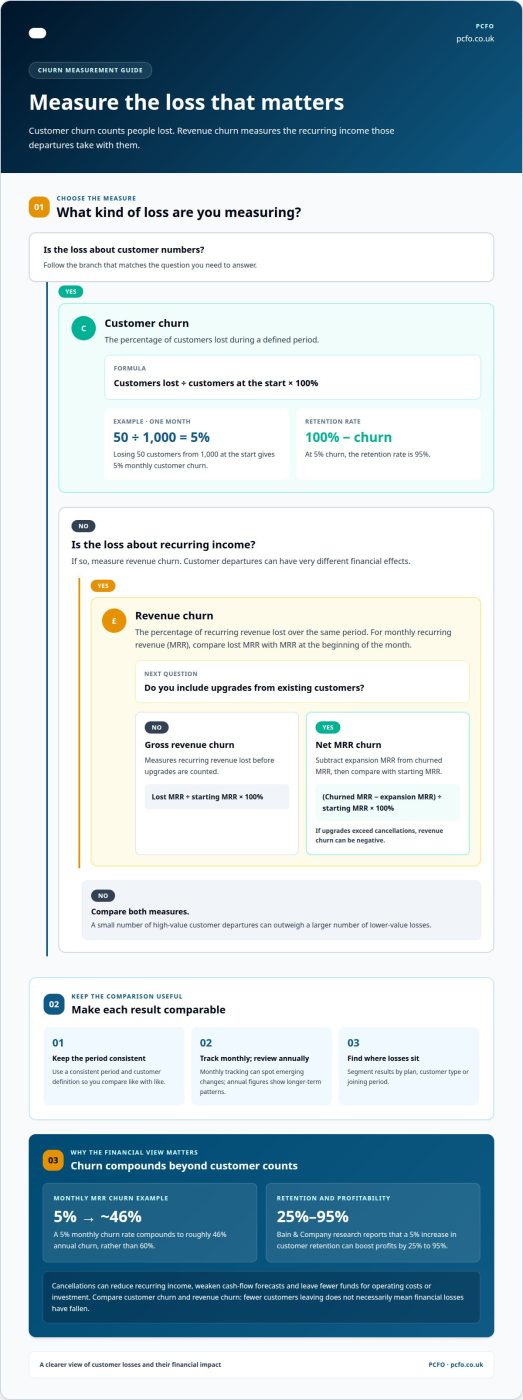
Lose 50 customers from a base of 1,000 in a month, and monthly customer churn is 5%. Calculate it by dividing customers lost during the period by the number at the start, then multiplying by 100%. Understanding churn rate and its financial impact means looking beyond customer counts: revenue churn tracks recurring income lost, so a small number of high-value departures can outweigh a larger number of low-value ones.
It’s natural to see churn as a measure of customer satisfaction, but it also affects the income available for operations, investment and growth. Replacing lost customers takes resources, while retaining them can make revenue more predictable.
This article explains how to measure churn, how it affects revenue and profitability, and why useful benchmarks vary by business model and customer segment. You’ll also see how financial planning, retention decisions and a clearer view of customer value can help shape a practical strategy for reducing churn.
Key Takeaways
- Distinguish customer losses from recurring revenue losses to see which departures create the greatest financial pressure.
- Assess how churn affects acquisition spending, profitability and the pace of sustainable growth.
- Compare your results with benchmarks that reflect your industry, business model and stage of maturity.
- Use customer value and financial planning to prioritise retention efforts and identify practical ways to reduce churn.
What Is the Churn Rate?
Churn measures the customers or recurring revenue a business loses over a defined period. Tracking both helps distinguish changes in customer numbers from the financial impact of cancellations.
Customer Churn and Revenue Churn
Customer churn is the percentage of customers lost, while revenue churn is the percentage of recurring revenue lost over the same period. The distinction matters because customers contribute different amounts: losing one high-value account can outweigh losing several lower-value customers. Net MRR churn also accounts for expansion revenue by subtracting upgrades from revenue lost, then comparing the result with starting MRR.
Calculating Customer Churn Rate
Calculate customer churn by dividing customers lost during a period by the customer base at its start, then multiplying by 100%. For example, losing 50 customers from 1,000 at the start of a month gives 5% monthly churn. Use a consistent period and customer definition so your analysis compares like with like. Retention rate is 100% minus churn.
Track customer and revenue churn monthly to spot emerging changes, then review annual figures for longer-term patterns. Rising cancellations can reduce future recurring income and customer lifetime value, particularly when departing customers would otherwise have continued purchasing. Segment results by plan, customer type or joining period to see where losses are concentrated.
Retention starts before renewal. Clear onboarding helps new customers understand the service and reach its value sooner. Review early cancellations alongside support issues, customer feedback and stated cancellation reasons. These signals can reveal whether expectations, pricing or the service experience need attention.
Use that analysis to prioritise changes: address recurring support problems, improve onboarding or refine the offer where customers see a mismatch in value. Assess retention measures against both customer numbers and revenue, since a smaller share of customers leaving does not necessarily mean financial losses have fallen.
Churn’s impact on revenue, profits and growth
Customer churn can reduce recurring revenue, weaken cash flow and leave less profit available for growth. Understanding churn rate and its financial impact starts with connecting cancellations to the income and resources your business needs to operate.
Calculating Monthly Recurring Revenue Churn
Monthly recurring revenue (MRR) churn measures recurring revenue lost from cancellations against starting MRR. Divide the lost MRR by MRR at the beginning of the month, then multiply by 100. A 5% monthly churn rate compounds to roughly 46% annual churn, rather than 60%. Tracking monthly patterns helps show how repeated losses shrink the revenue base available for future planning.
Revenue Churn Formulas and Examples
Gross revenue churn measures recurring revenue lost before upgrades are counted; net revenue churn also subtracts expansion revenue from existing customers. For net MRR churn, subtract expansion MRR from churned MRR, divide by starting MRR, then multiply by 100. If upgrades exceed cancellations, revenue churn can be negative. Comparing both measures shows whether growth from existing accounts offsets losses.
How does customer churn affect recurring revenue, cash flow and profitability? Cancellations reduce expected subscription income, making cash-flow forecasts less dependable and leaving fewer funds for operating costs or investment. Bain & Company research reports that a 5% increase in customer retention can boost profits by 25% to 95%. That distinction is central to understanding churn rate and its financial impact.
Churn also affects the return on customer acquisition spending. If customers leave before their contribution covers the resources used to acquire and serve them, growth becomes harder to sustain. A low churn rate alone doesn’t guarantee expansion; new customer growth must also support the business’s plans.
Revenue recognition and cash flow are related but distinct. Subscription revenue may be recorded over the service period, while cash arrives according to billing terms. Cancellations can reduce future recognised revenue and expected receipts, though timing depends on the contract and payment arrangements.
Retention initiatives should address the patterns behind departures. Review customer service issues and satisfaction feedback, then prioritise fixes that protect valuable relationships. For a financial review of these trade-offs, CFO services can support forecasting and growth planning.
Churn rate benchmarks by industry and business type
Churn benchmarks vary by business model, customer segment and measurement period. Compare your rate with a relevant average, while accounting for whether your company is early-stage or mature. Treat a benchmark as a reference, not a universal target: different churn rates can reflect different buying cycles and customer expectations.
Reported SaaS ranges differ, so check the definition and period behind each comparison. Monthly churn is given as 3% to 8% for SaaS companies, while subscription software companies often report 2% to 3%. Another benchmark describes monthly churn between 1% and 5% as healthy for SaaS and subscription businesses, with best-in-class companies closer to 1% to 2%.
- Established SaaS businesses: 5% to 7% annual churn; early-stage SaaS: 10% to 15% annually.
- Enterprise SaaS: 2% to 5% annually; SaaS focused on small and medium-sized businesses: 10% to 20% annually.
- E-commerce: 20% to 80% annual churn, depending on product category and purchase frequency.
- Service businesses: 15% to 25% annual churn.
- B2B software and professional services: 3.8% monthly churn on average; DTC businesses, including digital media, consumer goods and education: 6.5% monthly.
For B2B SaaS, annual customer churn below 10% is often considered good; below 5% may be best-in-class. Compare like with like: monthly rates cannot be directly compared with annual rates, and customer churn differs from revenue churn. The number of customers lost also matters less financially if those customers contribute very different amounts.
Use a benchmark to guide analysis, not to assume there is only one cause. Compare your churn across periods and customer groups, then investigate satisfaction, onboarding and renewal patterns. A new company may still be refining its offer, while a mature business can use its established customer base to identify worthwhile changes and retention investments.
Financial strategies for reducing churn
Reducing churn is both a financial decision and a customer experience priority. Compare the cost of a retention action with the revenue at risk, then focus resources where they can protect valuable customer relationships.
Start by separating voluntary cancellations from involuntary losses. Customer behaviour analysis and predictive analytics can help identify customers at risk of leaving. Pair those signals with customer surveys and Net Promoter Score (NPS) feedback. For example, declining engagement alongside negative survey comments can prompt timely outreach before dissatisfaction leads to cancellation.
- Improve the experience: use support data to find recurring problems, then refine the service or product. Measure whether the change affects churn, rather than assuming satisfaction has improved.
- Strengthen onboarding: identify where new customers struggle to reach value, then adjust guidance or support at that point in their journey.
- Use targeted incentives: consider discounts or loyalty rewards where they support continued engagement. Compare the incentive’s effect on retained revenue with its impact on margin.
- Monitor customer value: track churn alongside customer lifetime value and acquisition costs to assess whether retention efforts support sustainable returns.
Prioritise fixes using both the number of customers affected and the recurring revenue at risk. A widespread service issue may require a product change; an individual account concern may call for proactive support, such as outreach or live chat. This distinction directs spending towards the cause instead of applying the same discount to every customer.
Set a baseline, record each intervention and monitor results over consistent monthly periods. Product improvements or significant service enhancements may take 6 to 12 months to translate into measurably lower churn, so assess leading indicators, including support contacts and customer feedback, alongside cancellations.
For a financial review of retention priorities, discuss churn and business growth planning with a finance adviser.
PCFO: Finance Director Services
PCFO’s Finance Director Services can help you connect churn measures with financial planning and business decisions. If customer losses are affecting revenue forecasts, cash-flow planning or growth priorities, a Finance Director can bring these considerations into a clearer financial view.
For businesses shaping a broader growth plan, PCFO also provides Chief Financial Officer Services, Business Growth Advisory and Business Planning Consultant support. These services can help you assess how retention priorities fit your company’s plans and financial position.
If you’re ready to discuss how churn fits into your financial planning, visit pcfo.co.uk.
Turn retention insight into stronger planning
Make churn part of regular financial decision-making, not a metric reviewed in isolation. Understanding churn rate and its financial impact can help you assess which retention priorities support your wider business plans and where uncertainty may affect future decisions.
PCFO offers Finance Director Services, Chief Financial Officer Services and Business Growth Advisory to help businesses connect financial insight with planning and growth priorities. This support can be useful when churn complicates forecasts or makes it harder to decide where to focus resources.
Bring your questions and current priorities into a conversation, then explore how financial advice could support your next decisions. Contact PCFO to discuss churn and take a considered step towards more confident planning.
Frequently Asked Questions
Part 5: Identifying the Root Causes – Why Do Customers Leave?
Customers leave when a product, service or relationship no longer meets their needs, or when external circumstances change. Group cancellation reasons, such as poor onboarding, recurring faults, pricing concerns or a business closure. Then compare them with support records, customer feedback and account activity. This helps distinguish a fixable service issue from a departure your business could not reasonably prevent.
What Is the Meaning of Churn in Business?
Churn describes the loss of customers or recurring revenue over a defined period. It applies to businesses with ongoing customer relationships, including subscription services and companies with repeat-purchase models. For example, a supplier can track accounts that stop ordering, while a software company can track cancellations. Define what counts as an inactive or lost customer to make the measure more useful for internal decisions.
What is Logo Churn?
Logo churn is the number or percentage of customer accounts lost during a period, regardless of the revenue each account generated. “Logo” refers to a customer company or account, not a brand image. For example, if a business loses one large organisation and several smaller accounts, logo churn counts each lost account equally. It does not show the difference in revenue impact.
What is Revenue Churn?
Revenue churn measures recurring income lost when customers cancel or reduce their spending. A business can examine gross revenue churn, which counts losses before expansion, or net revenue churn, which accounts for additional spending by existing customers. These measures answer different questions: gross churn highlights revenue at risk, while net churn shows whether customer expansion offsets some or all of those losses.
What is customer churn rate and how is it calculated?
Customer churn rate is the percentage of customers lost from a starting customer base during a chosen period. Divide the customers lost by the number at the period’s start, then multiply by 100. For example, a business that begins with 200 accounts and loses 10 calculates 10 divided by 200, then multiplied by 100. Consistent definitions make comparisons across reporting periods meaningful.
What is the difference between customer churn and revenue churn?
Customer churn tracks lost accounts; revenue churn tracks the recurring income those accounts represent. The measures can move differently: losing one account with substantial monthly spend may create more revenue churn than losing several smaller accounts. Review both when assessing retention. Account counts show how widespread departures are, while revenue figures reveal their relative effect on the income base.