

A SaaS business can increase sales while weakening financially. Software as a service (SaaS) financial metrics in the UK show whether subscription income is dependable, customers stay, and growth costs are being recovered. They offer a clearer view of performance than revenue alone.
It’s understandable to focus on new sales, but that figure alone won’t show whether growth is sustainable. A useful set of metrics links recurring revenue with churn, customer acquisition cost and customer lifetime value, helping you understand how these measures affect one another.
This guide explains what key SaaS metrics mean and how to interpret them together. You’ll see how recurring revenue tracks subscription income, churn reflects customer retention, and acquisition cost compares with the value a customer brings over time. These figures can reveal important aspects of a SaaS business’s financial performance.
Key Takeaways
- Track recurring revenue to understand subscription income over time, and distinguish monthly performance from annualised revenue.
- Separate customer churn from revenue retention to see whether cancellations, downgrades or expansion are shaping your existing customer base.
- Compare customer acquisition cost with lifetime value to assess whether sales and marketing investment is translating into sustainable customer relationships.
- According to HM Revenue & Customs, the UK VAT rate is 20%; consider how financial reporting and planning support your wider business decisions.
Customer and revenue churn
Churn shows how subscription cancellations affect recurring revenue, while retention measures how much revenue remains. Read both alongside other SaaS accounting metrics to understand performance.
Key financial metrics for UK SaaS companies include monthly recurring revenue (MRR), annual recurring revenue (ARR), churn, customer acquisition cost (CAC) and lifetime value (LTV). MRR tracks active monthly subscriptions, while ARR annualises recurring revenue. CAC measures sales and marketing spend per new customer, and LTV estimates revenue across a customer relationship. Together, they show whether customer growth is translating into durable income.
Gross revenue retention
Gross revenue retention measures recurring revenue retained after customer churn and downgrades, excluding expansion and cross-sell. It helps you assess how much existing subscription revenue remains before upsells offset losses. Compare periods consistently to spot deterioration.
Retention and churn benchmarks
Customer churn rate is customers lost during a period divided by customers at its start, multiplied by 100. SaaS businesses have an average annual churn rate of about 5-7%. For UK businesses serving small and medium-sized businesses, the page gives a monthly churn target below 3%; for enterprise customers, it recommends below 0.75% monthly. Segmenting these figures helps identify where cancellations are concentrated.
Typical SaaS gross margin benchmarks in the UK start at 70%, with at least 75% a common target. Gross margin is revenue minus cost of goods sold, divided by revenue, then multiplied by 100. HM Revenue & Customs states that the UK VAT rate is 20%. It also states that the UK Patent Box applies a reduced corporation tax rate of 10% for qualifying companies.
To measure burn rate, calculate the cash the business uses over a period; runway is available cash divided by average monthly net burn. UK startups are advised to target a minimum cash runway of 15-18 months. Forecasting these measures alongside churn helps show whether recurring revenue can support planned spending.
Customer acquisition cost and lifetime value
Customer acquisition cost and lifetime value show whether revenue from new customers can justify the investment required to win and retain them. Read these measures together to assess acquisition efficiency, cash flow and capacity for growth.
Customer acquisition cost and sales spend
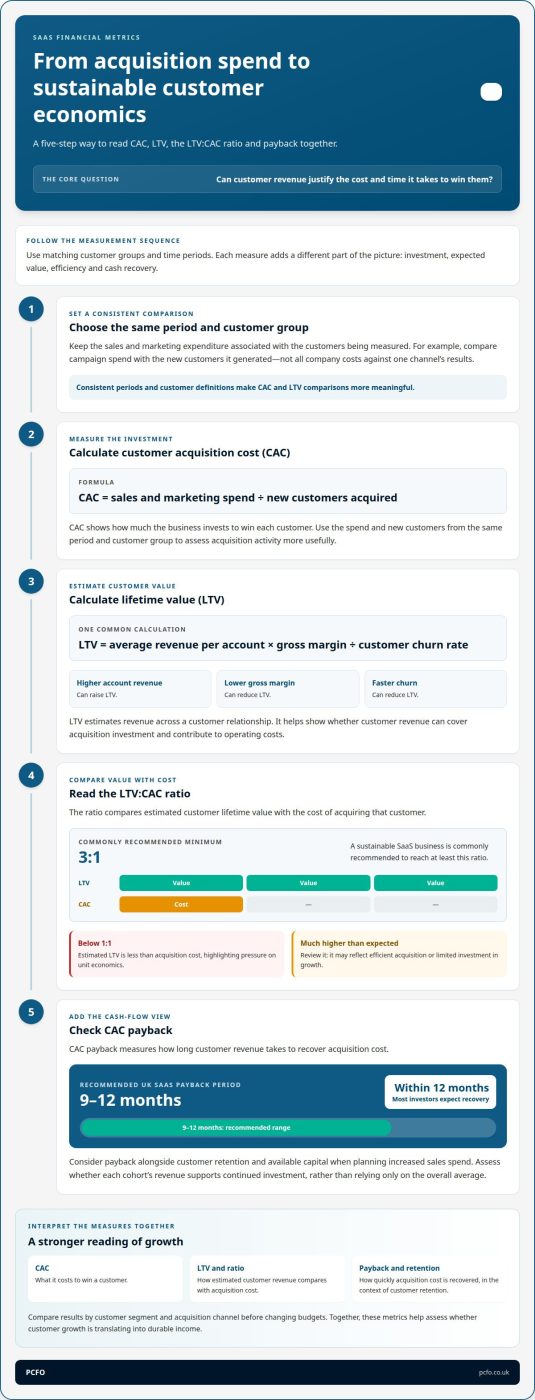
Customer acquisition cost (CAC) is total sales and marketing spend divided by the number of new customers acquired. It shows how much the business invests to win each customer, helping you judge whether increased acquisition spending is sustainable.
Include the sales and marketing expenditure associated with the same period and customer group. For example, compare campaign spend with the new customers it generated, rather than dividing all company costs by one channel’s results. This gives you a more useful view of which acquisition activities support recurring revenue.
Customer lifetime value
Customer lifetime value (LTV) estimates the revenue a customer generates over their relationship with the business. One common calculation multiplies average revenue per account by gross margin, then divides by the customer churn rate.
For instance, higher account revenue can raise LTV, while lower gross margin or faster churn can reduce it. LTV is useful alongside CAC because it indicates whether customer revenue can cover acquisition investment and contribute to operating costs. Use consistent periods and customer definitions to keep the comparison meaningful.
Lifetime value to acquisition cost ratio
The LTV:CAC ratio compares estimated customer lifetime value with the cost of acquiring that customer. A commonly recommended minimum for a sustainable SaaS business is 3:1.
A ratio below 1 means estimated lifetime value is less than acquisition cost, highlighting pressure on unit economics. A much higher ratio can also prompt review: it may reflect efficient acquisition, or limited investment in growth. Compare results by customer segment and acquisition channel before changing budgets.
CAC payback adds a cash flow perspective by measuring how long customer revenue takes to recover acquisition cost. A UK SaaS CAC payback period of 9-12 months is recommended; most investors expect recovery within 12 months. Compare payback with customer retention and available capital when planning increasing sales spend. A typical business should assess whether each cohort’s revenue supports continued investment, rather than relying only on the overall average.
Monthly and annual recurring revenue
Monthly recurring revenue (MRR) and annual recurring revenue (ARR) show the scale and direction of subscription income. For software as a service (SaaS) financial metrics in the UK, consistent definitions make these measures more useful for planning and comparison.
Calculate MRR by adding the monthly prices of active subscriptions. ARR is MRR multiplied by 12, giving an annual view of recurring income. Track new subscriptions, expansions and cancellations separately to explain changes between reporting periods. Exclude one-off income so recurring performance remains clear.
Average revenue per user (ARPU) is total revenue divided by the number of customers. It helps distinguish growth in customer numbers from growth in average account value. Pair ARPU with customer lifetime value and churn: higher ARPU can support profitability, but alone it doesn’t show whether customer relationships are lasting. Comparing customer groups can reveal where revenue changes originate.
Net revenue retention (NRR) measures recurring revenue retained from existing customers, accounting for upgrades, downgrades and churn. At 100%, the existing customer base maintains its revenue; above 100%, expansion has outweighed losses without new customers. Compare consistent cohorts to understand whether expansion is broad-based or concentrated in a few accounts. This gives context to other software as a service (SaaS) financial metrics in the UK.
Revenue recognition affects how subscription income appears in accounting. A UK SaaS business recognising a £1,200 annual subscription over a 12-month contract records £100 revenue each month as the service is delivered. This distinguishes cash received upfront from revenue earned over time.
UK VAT and accounting frameworks also affect reporting. HM Revenue & Customs states the UK VAT rate is 20%. UK SaaS businesses typically follow FRS 102 or IFRS 15 for revenue recognition; ASC 606 is a separate standard used in the United States.
What are SaaS metrics?
SaaS metrics turn customer behaviour and financial results into performance measures. Customer lifetime value, engagement and concentration help explain whether growth is sustainable.
Customer lifetime value and acquisition ratios
Customer lifetime value estimates the revenue generated across a customer relationship, while CAC records the cost of winning that customer. Comparing them helps you assess whether acquisition spending supports sustainable growth.
A commonly recommended minimum LTV:CAC ratio is 3:1. Treat it as a guide, not a standalone verdict: gross margin, retention and the time taken to recover acquisition costs also affect the picture. Compare customer cohorts to see whether changes in acquisition efficiency are improving unit economics.
Customer concentration and monthly growth
Customer concentration shows how much revenue depends on a small number of accounts. A SaaS company is advised to keep no more than 10% of revenue from one customer and 25% from its top five combined.
These measures help indicate exposure if a major account leaves or reduces its subscription. Monthly recurring revenue growth adds another view: early-stage SaaS startups typically aim for growth of 10-20%. Compare growth with concentration and retention, so rising revenue does not conceal dependence on a narrow customer base.
Customer monetisation and engagement
Customer monetisation measures how effectively a SaaS business turns customer relationships into revenue; engagement tracks product use. Monthly active users count people who engaged with the product over the previous 30 days.
Net promoter score (NPS) asks customers to rate their likelihood of recommending a product from 0 to 10. Scores of 9-10 are promoters, 7-8 are passives, and 0-6 are detractors. Read NPS alongside usage, revenue per account and retention: engagement may indicate product value, while customer feedback can reveal barriers to lasting use.
Valuation multiples by recurring revenue and growth
SaaS valuation multiples compare business value with a measure such as annual recurring revenue. ARR scale and growth rate help frame comparisons, alongside retention, margins and customer concentration.
There is no single multiple that applies to every UK SaaS business. A buyer or investor considers the quality and predictability of recurring revenue, growth trajectory and operating performance together. For a clearer view of how these measures inform growth decisions, explore Business Growth Advisory.
PCFO: Finance Director Services
PCFO provides Finance Director Services to help growing businesses turn financial metrics into informed decisions. When recurring revenue, churn, acquisition costs and customer value need to guide budgets or growth plans, a Finance Director can connect those measures to business performance.
For broader financial leadership, PCFO also offers Chief Financial Officer Services. Business Growth Advisory and Business Planning Services can help you assess growth opportunities and build plans around your company’s financial position. These services are useful when reporting is available but the implications for investment, cash flow or future priorities need clearer analysis.
If you’re ready to discuss how financial leadership could support your SaaS business, contact PCFO or visit pcfo.co.uk.
Turn financial insight into your next decision
Metrics are most useful when they shape decisions, not simply fill a dashboard. Start with the business questions that matter now, such as whether to invest in growth, adjust customer acquisition or protect cash flow. Then ensure your reporting provides a consistent basis for those choices.
For software as a service (SaaS) financial metrics in the UK, the next step is to connect the numbers with your priorities and plans. A clear financial view can help you test assumptions, understand trade-offs and decide where management attention will have the greatest value. It also provides a stronger foundation for discussions with your leadership team and stakeholders.
PCFO can help you consider how your SaaS metrics inform business decisions. Contact PCFO to discuss your SaaS metrics and identify a practical way forward. With a clearer view of performance, you can approach your next stage of growth with greater confidence.
Frequently Asked Questions
What is SaaS accounting?
SaaS accounting records subscription income, operating costs and other financial activity so a software business can understand its performance. It distinguishes cash received from revenue earned over a subscription period. For example, a business receiving an annual payment may recognise the income across the service term. Consistent treatment makes financial reports more useful for planning and decision-making.
How do UK SaaS companies calculate annual recurring revenue (ARR) and monthly recurring revenue (MRR)?
MRR is the sum of active subscriptions multiplied by their monthly prices; ARR is MRR multiplied by 12. Keep one-off set-up work separate from recurring subscription income, and apply the same inclusion rules each reporting period. This makes changes easier to explain.
What are typical customer acquisition cost (CAC) and CAC payback benchmarks for UK SaaS?
CAC is sales and marketing spend divided by new customers acquired; payback measures the time taken for customer revenue to recover that cost. A recommended UK SaaS CAC payback period is 9-12 months. Compare payback by customer segment and acquisition channel, since a company-wide average can hide longer recovery times for particular customer groups.
What are good net revenue retention (NRR) and customer churn benchmarks for SaaS companies?
Mercia Ventures considers NRR of at least 100% good for SaaS businesses, while leading UK SaaS companies often achieve 110-120%. Annual churn across SaaS businesses averages about 5-7%. Monthly targets depend on customer type: below 3% for small and medium-sized business customers, and below 0.75% for enterprise customers. Track each segment separately to identify retention issues.
What are typical lifetime value to CAC (LTV:CAC) ratios for SaaS businesses?
A commonly recommended minimum LTV:CAC ratio for a sustainable SaaS business is 3:1. Calculate the ratio using lifetime value and acquisition cost from comparable customer groups. If one cohort has a weaker result, examine retention, gross margin and acquisition channel before changing investment.
What are typical SaaS revenue growth and Rule of 40 benchmarks in the UK?
The Rule of 40 combines revenue growth and profit margin; it can help assess a SaaS company’s growth and profitability. Compare businesses at similar stages, as a growth rate alone doesn’t show profitability or cash requirements.